Try something like this
collected_at=* | timechart sum(1/300) as EPS by repo_name every 5 minutes
Hello all,
I would like to visualize:
 MPS sent by each log sources
 MPS per repo_name
I have managed to create a timechart of MPS per repo_name:
repo_name=* | timechart count() by repo_name
Note : This is not really MPS per repos, but log volume per repo.
But I cannot find how to generate the equivalent for each log sources.
Thanks for your help!
Share This Post:
Thank you for your answer. This seems working well
![]()
Hi,
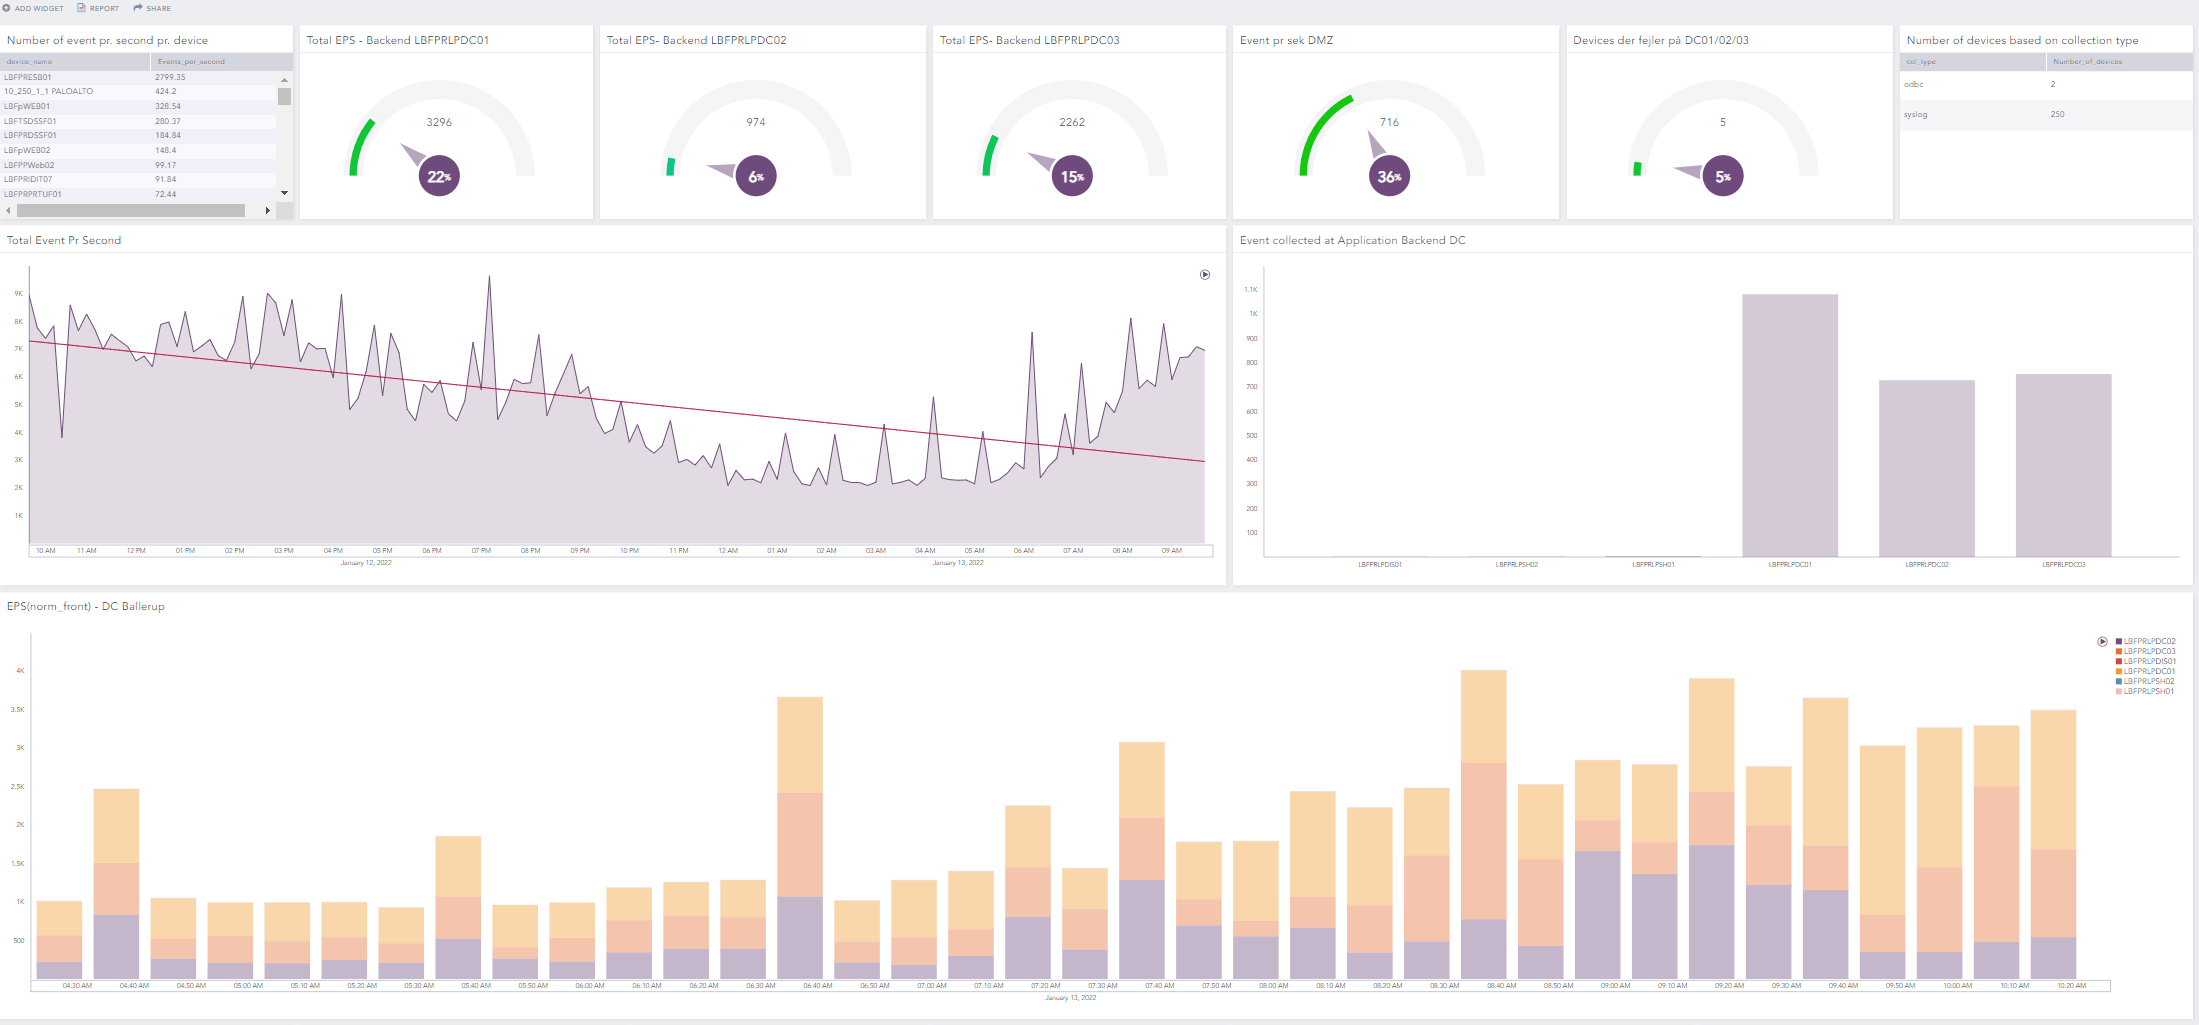
To monitor my system I Build this Dashboard, maybe it can help you.
The first line of widgets takes data from _logpoint repo, most important, the rest you figure out Windows restart from thes repoes, Logpoint serveres againg from _logpoint and so on.
DashBoard funktionality.:
- Witch device sends most events.
- EPS pr DC and DMZ
- Devices not sending
- Collection types of data, and amount
- Total EPS all repoes
- Distribution of data on each DC
- Logpoint Server restarted
- Windows Server restarted
- Logs pr server after Load Ballancer.
-
Last Widget keeps an eye on Support, and what they are doinge when loged in. ;)
Hi,
Is It possible for you
@Kai Gustafson
to send over the querys of the widgets that you are using on you “monitor” dashboard?
It seems like the attachment is unavailable, I cannot open it.
Thanks
UPDATE!
I got It working. Your attachment worked
Shure, now with some added features.
Regards Kai
Hi again
Ooh thanks.
Some questions. Does this dashboard impact the resources of the LogPoint. Cause most of the widgets search through all my repos that I have.
The widgets,
- Total EPS - Backend LBFPRLPDC01
- Total EPS - Backend LBFPRLPDC02
- Total EPS - Backend LBFPRLPDC03
Are these devices namnes? Or is the name LBFPRLPDCXX name of the backend servers that you have?
Hi,
The DC01,02 and 03 are the Datacollectors sitting behind a Loadballancer.
For the event pr sec counters only repo you ned are _Logpoint
For finding most active device you have to traverse all the repoes where devices are storing data
Widget: Number of event pr. second pr. device
Windows Server reboots you use your windows repo for.
and LP server reboots you use _Logpoint
So the most of these widgets are using _Logpoint and does not impact the performance at all.
Hope this will help you progress in your quest ;)
Regards Kai
Okey! I don’t have any information or knowledge about Data Collectors. Is It an LogPoint that you have changed mode to a Data Collector?
Perfect! Switched most of the widgets to the repo (_logpoint).
Your widgets (Total EPS - Backend LBFPRLPDCXX) have I switched to my indexservers. Were all the devices and normalisations policys are configured on.
It seems like one of my indexservers Is working and have more usage in % than the other, which Is not that good.
Hi,
May I ask anyone to share the queries for all the dashboards above?
Please sign in to leave a comment.
9 comments