SIEM - Searching & Analytics
-
[HOW TO] plot something other than the frequency in search
Dear fellow LogPoint users,
I would like to plot a given quantity over time in search and in my dashboards. For example, the GBs of data transferred over time, or the values of a time table. To my understanding chart, as well as timechart does not allow this. These functions only aggregate the number of occurences within the given time-interval (like in a histogram).
Is there a way to do this?
Best regards,
Georg -
how to compare different times in search
Dear fellow LogPoint users,
I am wondering if there is the possibility to compare the results of a querry for different times in one plot?
This would be very helpful to identify regularities/irregularities. For example, the number of logs received today over the number of logs received yesterday and the day before. Yes, I can create a dashbord and stack the corresponding widgets on top one another. However, it would be helpful to be able to directly compare the curves in one plot.
Thanks in advance
Georg
-
Login Unknown User Formant Alert Rule
Hello
Our company very recently configured a Logpoint for ourself and a Customer.
the Customer asked for a alert rule, to Alert us and them, whenever someone Attempts to login with a Unknown username format. To see those attempts and see if someone accidentally typed their Password in the username Field.for this I created this rule (there is probably better ways to do this)
-("source_address"="ip") -("source_address"="iü") -("user"="du*") -("user"="MINWINPC") -("user"="ch*") -("user"="firewall") -("user"="aa*") -("user"="da*") -("user"="nu*") -("user"="su*") -("user"="la*") -("user"="cba_anonymous") -("user"="ex*") "reason"="Unknown user name or bad password." "event_category"="Logon" device_ip=ip or device_ip=ipThe Rule ended up being pretty long, but it mostly works.
The mostly being that it generates a lot of noise, because there is a lot of Alerts with user Null, so empty, these alerts seem to come from the DC itself.
And I am trying to Exclude null from the search.
I tried.-(“user”=”null”), -(“user”=”NULL”), -(“user”=”*”) and -(“user”=*)
but none of them actually excluded null.Does anyone Know or have an idea on how to Exclude null results in a search, that would be a great help.
Also open for more efficient ways for the rule since it is really loong haha.
Thanks in advance Cheers Mike -
PowerExchange Malware backdoor - Exchange servers
Hi!
Is there anyone in this community thas has some knowledge about the recently malware backdoors on Microsoft Exchange servers?
I would like to investigate this further and do some threat hunting. Does anyone here has some threat hunting querys in LogPoint?
-
j
.
-
meaning of the "count() function"
Hi !
I would like to know a little more about the “count() function” in logpoint and it’s meaning. In fact as you can see in screen shot I received a log at 10:42:53 and count() is equal to 53 and theye are normaly 53 logs. But when I clic on this line (log) all of these 53 logs are exactly the same ! what is meaning ? How can I interpret ? Is it just one log (one action realised) ? or theye are really 53 logs (53 actions realised)
Thank you in advance for your help.
Best regards
Siawash
-
Is LogPoint using LogPoint SIEM itself for their IT infrastructure?
I sometimes wonder if LogPoint (as a company) itself uses its own LogPoint SIEM to monitor its IT infrastructure (servers, clients, firewalls, etc.)? (see eating your own dog food principle)
I ask this because whenever it comes to user experience and serious functional errors in the software, I often have the feeling that only the support staff use the SIEM in their small virtualised test environments.
They then have only a few log sources connected (or pools and machine in the director environment), which means that some problems that only occur in very large environments do not appear at all.Two simple examples:
- If so many entries are to be displayed in the UI that a scrollbar becomes necessary, this is sometimes not implemented correctly or poorly in terms of UX.
- If the indexsearcher or other services simply crashes with "something is wrong" in the UI when running a search and do not deliver any further messages or hints and thus the entire service promise of a security provider is at stake.
I would guess that due to the short feedback loop within the company, many problems and bugs could be solved much faster if LogPoint had their own product in productive use.
LogPoint is soon at version 7.2 (!) and in some cases it is still not possible to guarantee that alert rules will run uninterruptedly without becoming obviously noticeable in the event of an error. I would expect this in early versions but not in 7 and onwards. I currently see the focus far too much on SOAR and other hyped gimmicks, while the base functionality of the SIEM is not working sufficiently.
-
Scanned ports
Hi !
I would like to know if it is possible to know hwo has scanned the sources ports and destinations ports ?
Thank you in advance :)
Best regards,
Siawash
-
Enrich search results with the related data from a lookup table uploaded in Logpoint
Hi All,
We are happy to share that we have released a new version of our lookup plugin.
Lookup enriches logs with data from a Lookup table uploaded in Logpoint using CSVEnrichmentSource . You must install CSV Enrichment Source to upload the Lookup table.
Lookup supports the following process commands:
To learn more, please see the links below.
Release note: https://servicedesk.logpoint.com/hc/en-us/articles/9314493946525-Lookup
Documentation: https://docs.logpoint.com/docs/lookup-process-plugin/en/latest/
-
BLACKLIST_COUNTRY
Hi !
I would like to create a widget with all connexions from a black list counrty. But I don’t it si possible or not !
Would like to know if is that possible or not? if is this possible, please could you tell me how can I get a list like that?
Thanks in advance
Looking forward to reading you
-
Formular to calculate first alert rule search time range
Is there a formula by which the first search timerange (from to) of a newly created alert rule could be calculated?
For example, if I create a new alert rule with 24 hours time range NOW (e.g. at 10:00 AM), the first search will run between yesterday 6:00 AM and today 5:00 AM. Naively, I would have expected the search to run from yesterday 10 AM to today 10 AM.
If I create an alert rule that has e.g. 5 minutes search time range, then the first search runs about 25 minutes to 20 minutes before the alert rule is activated.
So the search time range of the alert rule search varies depending on the alert rule time range.Since I am developing an alert rule test environment that activates alert rules and ingests pre-made logs, it would be significant to set the timestamps in these pre-made logs so that they occur in the timerange in the first search run of the alert rule.
So the question is, if there is a formula for this, with which I can determine the time period in advance, in which the alert rule search will run.
-
Indexsearcher write.lock Issues?
Has anyone of you seen errors during running a search over a larger timerange (+24 hours) from the indexsearchers reporting a missing “write.lock” file?
Here is an example log of such a case:
2022-12-11_00:00:45.94320 00:00:45.943 [pool-1-thread-3] WARN c.i.shared.lib.logging.util.LogUtil - Exception occurred during index closing;2022/08/11/1660176000
2022-12-11_00:00:45.94330 00:00:45.943 [pool-1-thread-3] WARN c.i.shared.lib.logging.util.LogUtil - Exception occurred during index closing;2022/08/09/1660003200
2022-12-11_00:00:45.97880 java.nio.file.NoSuchFileException: /opt/makalu/storage/indexes/M365/2022/08/11/1660176000/write.lock
2022-12-11_00:00:45.97888 at sun.nio.fs.UnixException.translateToIOException(UnixException.java:86)
2022-12-11_00:00:45.97888 at sun.nio.fs.UnixException.rethrowAsIOException(UnixException.java:102)
2022-12-11_00:00:45.97888 at sun.nio.fs.UnixException.rethrowAsIOException(UnixException.java:107)
2022-12-11_00:00:45.97889 at sun.nio.fs.UnixFileAttributeViews$Basic.readAttributes(UnixFileAttributeViews.java:55)
2022-12-11_00:00:45.97889 at sun.nio.fs.UnixFileSystemProvider.readAttributes(UnixFileSystemProvider.java:144)
2022-12-11_00:00:45.97890 at sun.nio.fs.LinuxFileSystemProvider.readAttributes(LinuxFileSystemProvider.java:99)
2022-12-11_00:00:45.97891 at java.nio.file.Files.readAttributes(Files.java:1737)
2022-12-11_00:00:45.97892 at org.apache.lucene.store.NativeFSLockFactory$NativeFSLock.ensureValid(NativeFSLockFactory.java:177)
2022-12-11_00:00:45.97892 at org.apache.lucene.store.LockValidatingDirectoryWrapper.createOutput(LockValidatingDirectoryWrapper.java:43)
2022-12-11_00:00:45.97892 at org.apache.lucene.index.SegmentInfos.write(SegmentInfos.java:516)
2022-12-11_00:00:45.97892 at org.apache.lucene.index.SegmentInfos.prepareCommit(SegmentInfos.java:809)
2022-12-11_00:00:45.97893 at org.apache.lucene.index.IndexWriter.startCommit(IndexWriter.java:4439)
2022-12-11_00:00:45.97893 at org.apache.lucene.index.IndexWriter.prepareCommitInternal(IndexWriter.java:2874)
2022-12-11_00:00:45.97893 at org.apache.lucene.index.IndexWriter.commitInternal(IndexWriter.java:2977)
2022-12-11_00:00:45.97893 at org.apache.lucene.index.IndexWriter.commit(IndexWriter.java:2944)
2022-12-11_00:00:45.97893 at com.logpoint.indexsearcher.indexer.ImmuneIndex.closeAll(ImmuneIndex.java:179)
2022-12-11_00:00:45.97894 at com.logpoint.indexsearcher.indexer.IndexManager.deleteExtraIndexer(IndexManager.java:1147)
2022-12-11_00:00:45.97894 at com.logpoint.indexsearcher.indexer.Indexer.checkPartition(Indexer.java:134)
2022-12-11_00:00:45.97894 at com.logpoint.indexsearcher.indexer.Indexer.createPartition(Indexer.java:347)
2022-12-11_00:00:45.97894 at com.logpoint.indexsearcher.indexer.Indexer.index(Indexer.java:266)
2022-12-11_00:00:45.97894 at com.logpoint.indexsearcher.indexer.MultiThreadedRunnableIndex.index(MultiThreadedRunnableIndex.java:148)
2022-12-11_00:00:45.97894 at com.logpoint.indexsearcher.indexer.MultiThreadedRunnableIndex$IndexingThread.run(MultiThreadedRunnableIndex.java:323)
2022-12-11_00:00:45.97895 at java.util.concurrent.ThreadPoolExecutor.runWorker(ThreadPoolExecutor.java:1149)
2022-12-11_00:00:45.97895 at java.util.concurrent.ThreadPoolExecutor$Worker.run(ThreadPoolExecutor.java:624)
2022-12-11_00:00:45.97895 at java.lang.Thread.run(Thread.java:748)
2022-12-11_00:00:45.97908 java.lang.RuntimeException: /opt/makalu/storage/indexes/M365/2022/08/11/1660176000/write.lock
2022-12-11_00:00:45.97910 at com.logpoint.indexsearcher.indexer.Indexer.createPartition(Indexer.java:378)
2022-12-11_00:00:45.97911 at com.logpoint.indexsearcher.indexer.Indexer.index(Indexer.java:266)
2022-12-11_00:00:45.97911 at com.logpoint.indexsearcher.indexer.MultiThreadedRunnableIndex.index(MultiThreadedRunnableIndex.java:148)
2022-12-11_00:00:45.97911 at com.logpoint.indexsearcher.indexer.MultiThreadedRunnableIndex$IndexingThread.run(MultiThreadedRunnableIndex.java:323)
2022-12-11_00:00:45.97911 at java.util.concurrent.ThreadPoolExecutor.runWorker(ThreadPoolExecutor.java:1149)
2022-12-11_00:00:45.97911 at java.util.concurrent.ThreadPoolExecutor$Worker.run(ThreadPoolExecutor.java:624)
2022-12-11_00:00:45.97912 at java.lang.Thread.run(Thread.java:748)
2022-12-11_00:00:45.97927 00:00:45.979 [pool-1-thread-3] ERROR c.i.shared.lib.logging.util.LogUtil - IndexingThread; indexingThread; /opt/makalu/storage/indexes/M365/2022/08/11/1660176000/write.lock
2022-12-11_00:00:48.00775 Exception in thread "Thread-1" java.lang.RuntimeException: java.nio.file.NoSuchFileException: /opt/makalu/storage/indexes/M365/2022/08/11/1660176000/write.lock
2022-12-11_00:00:48.00777 at com.logpoint.indexsearcher.indexer.SaveOnShutdown.run(SaveOnShutdown.java:21)
2022-12-11_00:00:48.00789 Caused by: java.nio.file.NoSuchFileException: /opt/makalu/storage/indexes/M365/2022/08/11/1660176000/write.lock
2022-12-11_00:00:48.00790 at sun.nio.fs.UnixException.translateToIOException(UnixException.java:86)
2022-12-11_00:00:48.00790 at sun.nio.fs.UnixException.rethrowAsIOException(UnixException.java:102)
2022-12-11_00:00:48.00790 at sun.nio.fs.UnixException.rethrowAsIOException(UnixException.java:107)
2022-12-11_00:00:48.00790 at sun.nio.fs.UnixFileAttributeViews$Basic.readAttributes(UnixFileAttributeViews.java:55)
2022-12-11_00:00:48.00791 at sun.nio.fs.UnixFileSystemProvider.readAttributes(UnixFileSystemProvider.java:144)
2022-12-11_00:00:48.00792 at sun.nio.fs.LinuxFileSystemProvider.readAttributes(LinuxFileSystemProvider.java:99)
2022-12-11_00:00:48.00792 at java.nio.file.Files.readAttributes(Files.java:1737)
2022-12-11_00:00:48.00792 at org.apache.lucene.store.NativeFSLockFactory$NativeFSLock.ensureValid(NativeFSLockFactory.java:177)
2022-12-11_00:00:48.00792 at org.apache.lucene.store.LockValidatingDirectoryWrapper.createOutput(LockValidatingDirectoryWrapper.java:43)
2022-12-11_00:00:48.00793 at org.apache.lucene.index.SegmentInfos.write(SegmentInfos.java:516)
2022-12-11_00:00:48.00793 at org.apache.lucene.index.SegmentInfos.prepareCommit(SegmentInfos.java:809)
2022-12-11_00:00:48.00793 at org.apache.lucene.index.IndexWriter.startCommit(IndexWriter.java:4439)
2022-12-11_00:00:48.00793 at org.apache.lucene.index.IndexWriter.prepareCommitInternal(IndexWriter.java:2874)
2022-12-11_00:00:48.00793 at org.apache.lucene.index.IndexWriter.commitInternal(IndexWriter.java:2977)
2022-12-11_00:00:48.00794 at org.apache.lucene.index.IndexWriter.commit(IndexWriter.java:2944)
2022-12-11_00:00:48.00794 at com.logpoint.indexsearcher.indexer.ImmuneIndex.closeAll(ImmuneIndex.java:179)
2022-12-11_00:00:48.00794 at com.logpoint.indexsearcher.indexer.IndexManager.close(IndexManager.java:145)
2022-12-11_00:00:48.00795 at com.logpoint.indexsearcher.indexer.Indexer.shutdownIndexer(Indexer.java:206)
2022-12-11_00:00:48.00796 at com.logpoint.indexsearcher.indexer.SaveOnShutdown.run(SaveOnShutdown.java:19)
2022-12-11_00:00:48.79674 Starting indexsearcher_M365
2022-12-11_00:01:10.64122 creating new msg retriever
We see this often (3-4 times per week) but irregularly. Sometimes (as in the error log above) the indexsearcher is crashing and restarting, which “solves” the problem temporarily for a few hours or days.
We excpect that this also causes alert rules to not run properly.
-
Count number of entries in Dynamic list
How can we count number in entries in dynamic list?
-
Split same field values into two fields.
If i have an event_category= User, Logon. I want to be able to create new fields (e.g. X, Y) and present data like X=User and Y=Logon. What would be the query to showcase this in result.
-
Delete an entry from Table
I have a table that is populated frequently using query scheduled in the report. I am trying to remove an entry from the table.
How can this be achieved.
-
Add more Information to a Report
Hi there,
i’m new using Logpoint. So i need some help for a search i would like to do. I would like to add some more information to the search “Top 10 User in Failed Kerberis Authentication” there i would like to add on which workstation the user have tryed to logon.
-
AzureLogAnalytics released
Hi All,
AzureLogAnalytics is now released, enabling you to fetch and analyze Azure Log Analytics workspace logs.
For downloading instructions and documentation, please visit the links below:
Help Center: https://servicedesk.logpoint.com/hc/en-us/articles/360017971858
Documentation: https://docs.logpoint.com/docs/azureloganalytics/en/latest/
-
Display List Elements like Tabel?
It is possible to use the search query
Table TABLE_NAMEto list the content of the table “TABLE_NAME”.
But there seems to be no possibility to do the same with a list.
Or did I miss something?
-
Incident Reporting Overview with Search Query
Hi,
I have been looking into how to get an overview over actions taken by an Security Analyst whilst using the Incidents view on Logpoint.
Therefore i have created this Search Query to get an overview over Incdents and Actions.
Repository to be searched on is _LogPoint
incident_id = * | chart count() by incident_id, log_ts, alert_id, status, action, user, alert_name, comment order by incident_id, log_ts asc
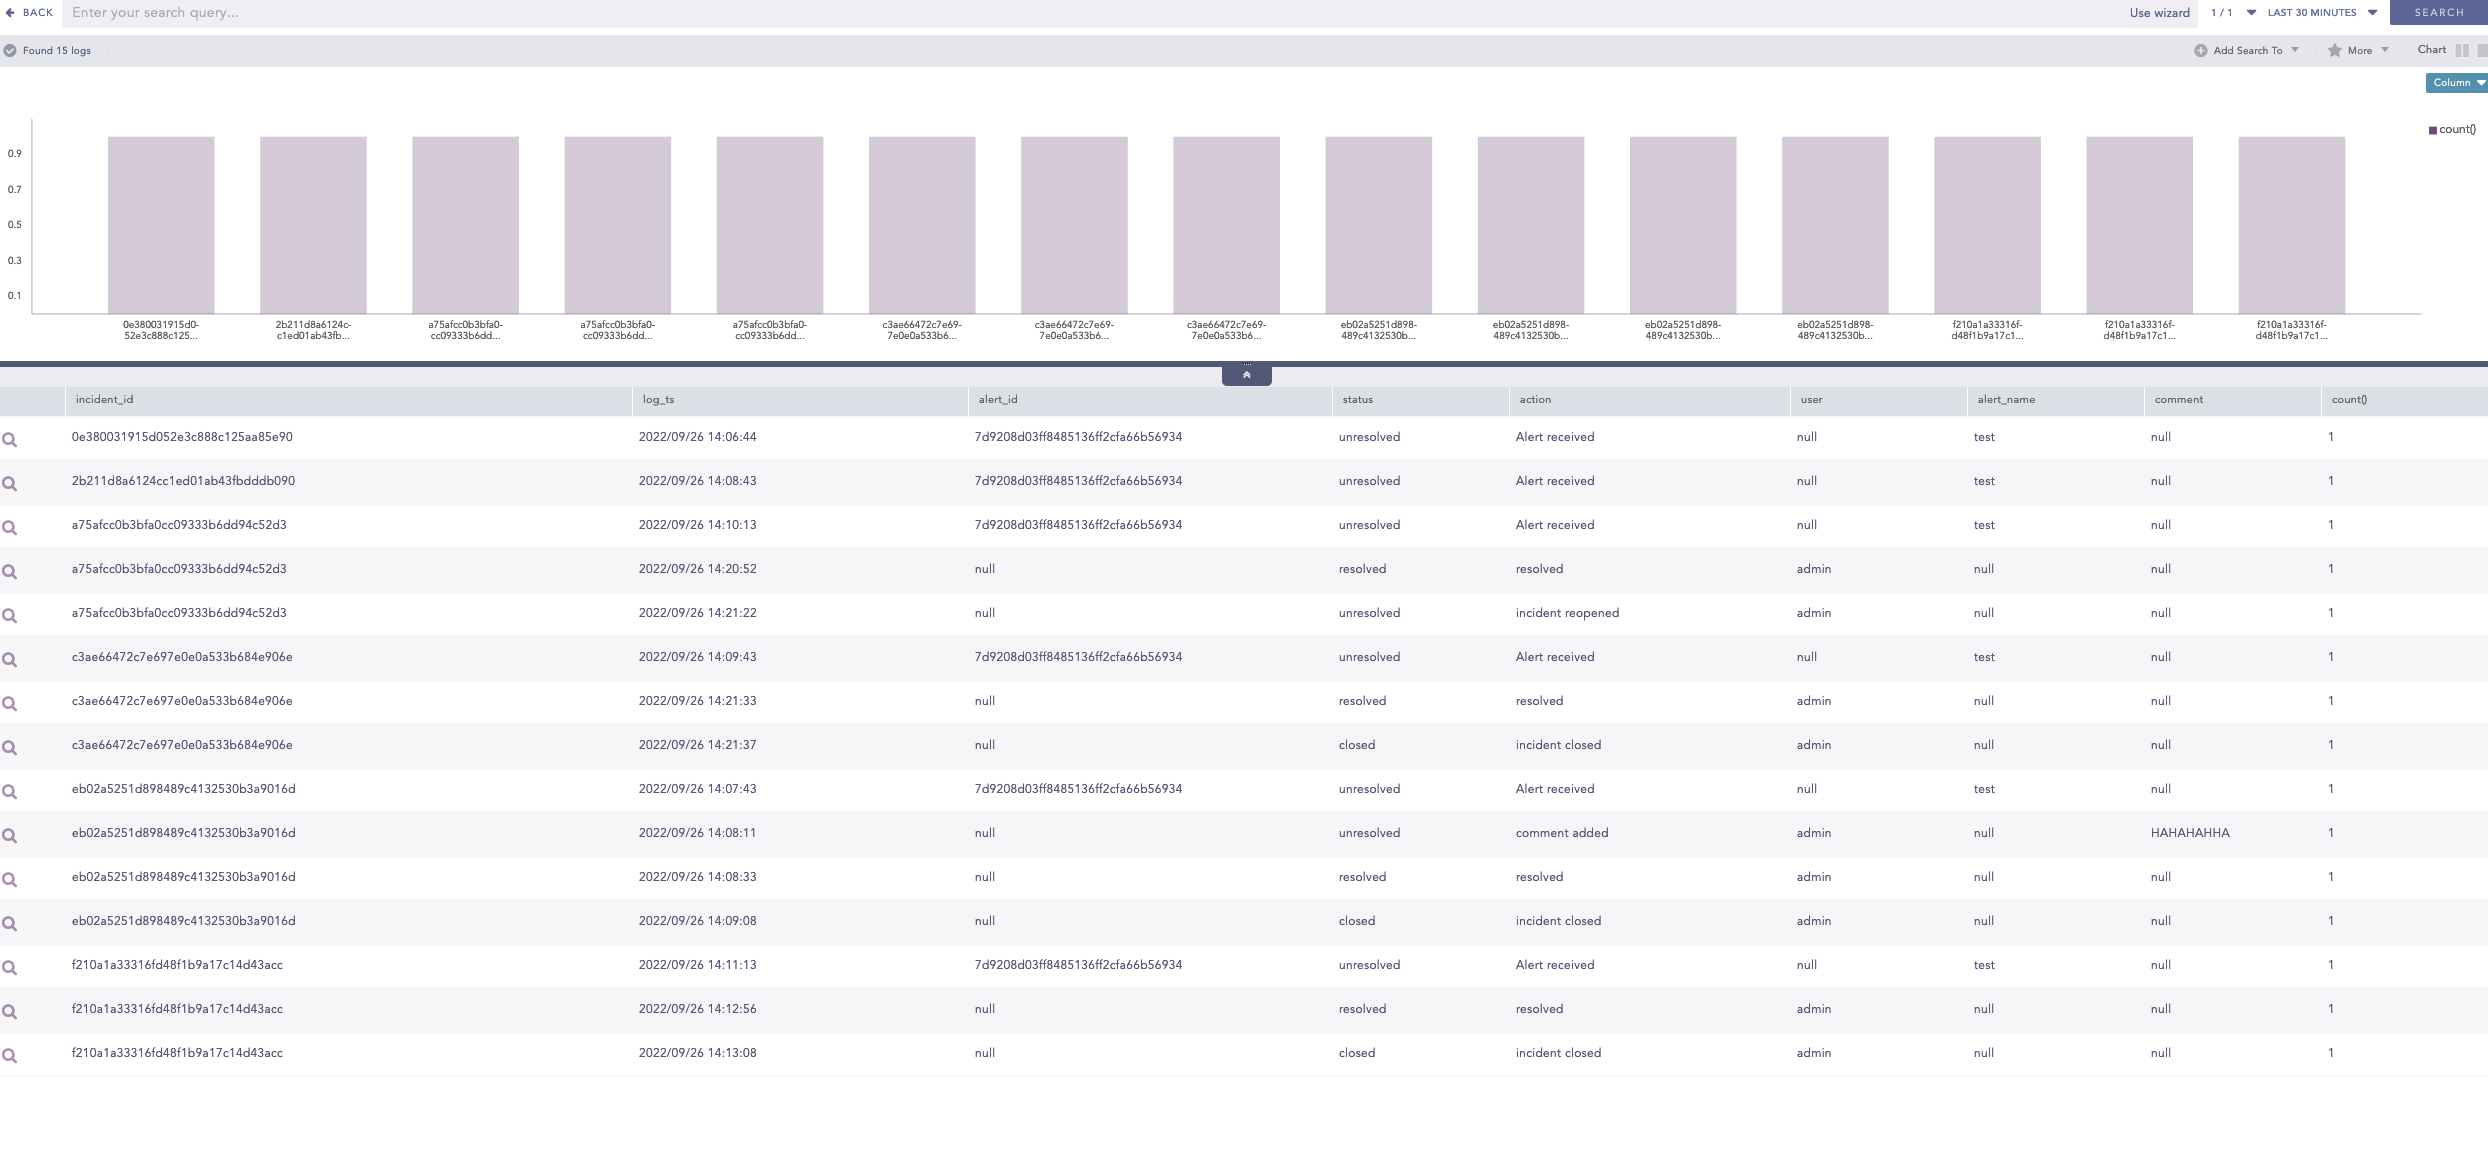
Hope this could be useful.
Best Regards,
Gustav -
Enrich DHCP Logs, With ISE Cisco Logs. To see Switchports
Hi there.
So we Have a Alert rule, that alerts us when a Unknown and New Device, leases a DHCP Adress, to prevent unwanted Physical Access.
Now We wanted to Enrich said DHCP log, by adding Information of our ISE/Switch Logs, so that when we get the Incident from the Alert rule, we also see what Switch and Switchport, this Unknown device is Hanging at.
We are Pretty sure that should be Possible, but I haven’t figured out how yet.
Cheers Mike Furrer -
Monitoring Alerting Services
Hi All,
Alerting is one of the core feature of Logpoint, in the article below we collected a compact list of the precautions that can be done to ensure that alerting runs smoothly and what to do if you realize the alerts weren't triggered.
To read the full article, please follow the link below:
https://servicedesk.logpoint.com/hc/en-us/articles/6013024248093-Monitoring-Alerting-Service
-
Show Alert Detail within the search
Hello Guys,
Is there a possibility to show the “Alert Details” within a search, so we can execute filtering and combining with other searches to get a special reporting on this infomation?
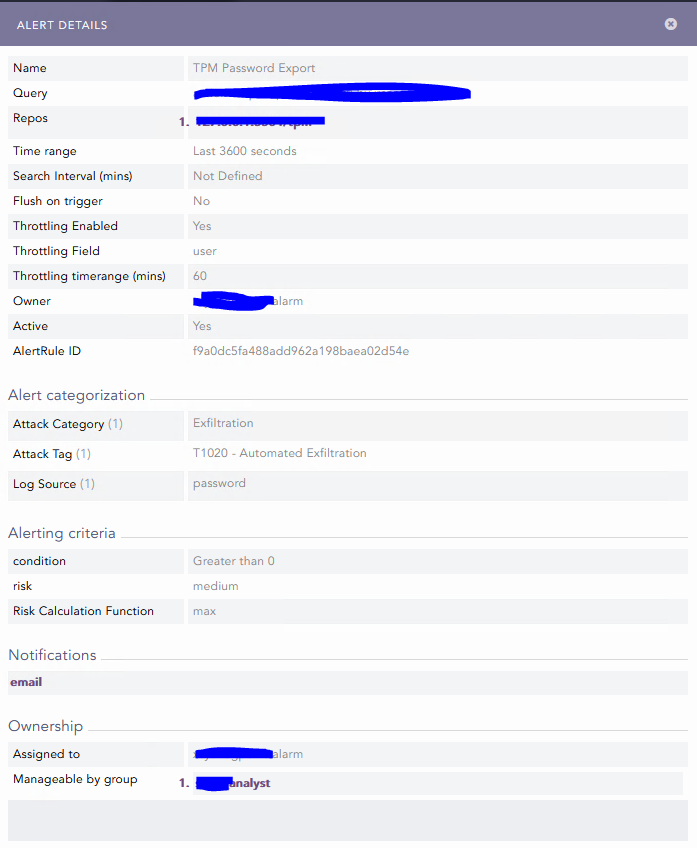
Alert Details -
Search for configuration within the search bar
Hey,
Iam searching for a possibility to return the configuration of defined alert rules in the logpoint search tab.
Background: I would like to report over icindents which are created by alert rules for a specific user group. We got several test alarms, which are “managed” by an other user and which should not appear in the report. So I have to combine the configuration of alert rules and the results with “repo_name="_logpoint" action="Alert received" | chart count () by alert_name, risk_level”.
Unfortunately I could not find a way to bring up the alert rule configuration with a search and combine the result with another search to narrow down the alert rules which I need to report. (I dont want to do that manually per hand by tyoing the names in the search)
I came over this idea because I have done such things with Splunk in the past. (was like an API-Call within the search bar to return internal configuration parameters)
Is it even possible to get the configuration of the XXX back as a json/xml (or other) string?
Thanks in advance.
BR,
Sascha -
Threat Intelligence - What are your experiences \ do you have recommendations ?
Hello,
just wanted to “pick the brains” of my fellow LP community member regarding TI. Is anyone here actively using the Threat Intelligence feature of the LogPoint and \ or has any recommendations and experiences on the matter. Personally i think it could be a very valuable part in a LogPoint environment to increase the detection capabilities, but have not be able to set it up in a way that would really beneficial.
This is mainly due to the fact that i haven’t been able to find a decent (free) TI feed, and to my mind, the value of TI stands and falls with the quality of the feed data.
Most of my customers have their firewalls, spam and web filter devices and mostly even their centralized AV solution sending their logs to LP. Setting up monitoring DNS request wouldn’t be a problem either. So i think we have enough visibility into the network traffic. Having a decent TI feed could allow us to compare these logs for known IoC (IP, hostnames, email addresses) and take a look at endpoints who have visited known malware URLs (spreading malware, being C2C server etc) or have received emails from known bad hosts in the past. You could then take a closer look at these endpoints if these could have been compromised.However, i have tried several freely available TI feeds, but none of them had the quality to be actually useful. Most had a lot of false positives as the feed are not updated regularly or have very outdated informationen. Additionally, these feeds also had a lot of false negatives (IP, URLs which were blocked by Google for days were not included yet). None of my customers has the manpower to sieve through hundreds of incidents a day just to find out the IoC is actually of a malware campaing from 2020.
How are your experiences with TI feeds, paid or unpaid ? I have to admit that, due to the rather poor experiences with free feeds, i did not look into any paid feeds (though i am trying to find the time to take Recorded Future for a test ride :-) i think they still have a demo offer)?
Does anyone of you have a recommendation for a feed ? Are paid feeds worth their money, and how much do they roughly cost ?
Regards
Andre
-
Search Query Placeholder/Wildcard for Exact Amount of Characters?
Is there a way to replace a certain number of characters with a wildcard in a search query? The asterisk (*) is unfortunately too unspecific for my purposes.
In other query languages there is for example the "?" for a character, or in regex the ".{n}" quantifier, where "n" is the number of characters.
A typical application would be the detection of a base64 encoded single char variable assignment like this:
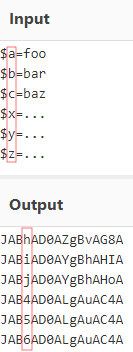
thus having a search query like this would be very helpful:
script_text=”*JAB?AD0A*” -
alert creation with ForeScout
Hello,I would like to create several use cases for the "ForeScout" security device.Do you have any ideas how I would like to set up alerts with ForeScout?
-
New Threat Intelligence v6.1.0 - out now
For those of you that do not subscribe to TI updates I can inform that version 6.1.0 is now available. See information and Knowledge Base Package here: https://servicedesk.logpoint.com/hc/en-us/articles/115003790549
Regards,
Brian Hansen, LogPoint
-
Brochure
Dear Sirs
Where I can Find a Brochure for SIEM for to send to our Customers in South America ?
-
Using Timestamp in Search Template Variable?
Is it somehow possible to use a timestamp in a search template variable?
For example I want to compare log_ts to be between two timestamps.
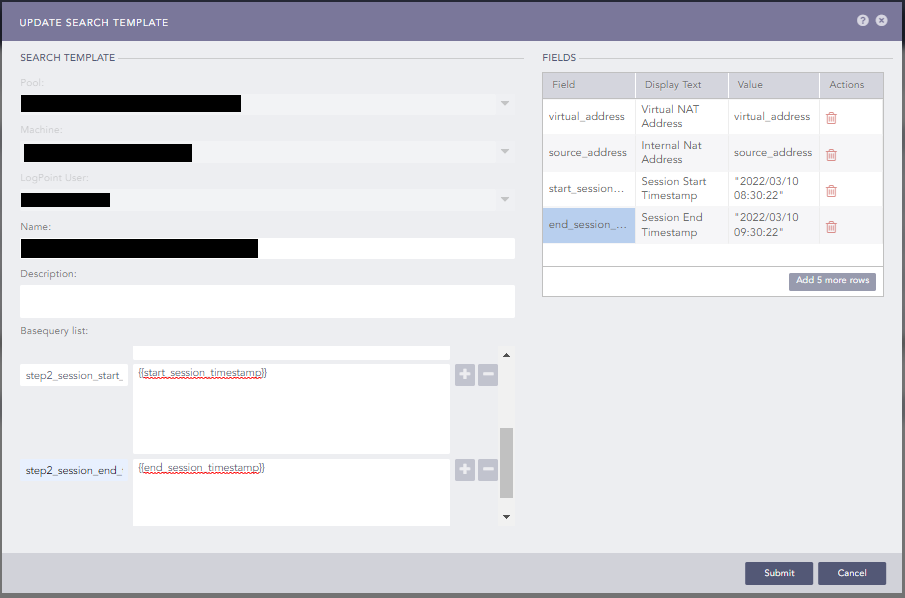
Therefore I added “fields” in the template config and added them to base queries. But it always either complains about the quotes (“) or the slashes inside the timestamp string (e.g. "2022/03/10 08:30:22").
See the example below:
If I now use the base queries in widget, it throws the said errors.
Detailed configuration to reproduce as follows:
Fields:
Field Display Text Value start_session_timestamp Session Start Timestamp 2022/03/10 08:30:22 end_session_timestamp Session End Timestamp 2022/03/10 09:30:22 Basequeries:
step2_between_timestamps log_ts >= "{{ start_session_timestamp }}" log_ts <= "{{ end_session_timestamp }}"Widget:
Name Test Query {{step2_between_timestamps}}Timerange 1 Day Is this a bug or am I doing it wrong?
-
Query returning no logs when field is [ true ]?
Hey folks,
First time posting here - I’ve got a bit of a strange issue when querying for a specific type of log.
We have our Azure AD logging to Logpoint and I wanted to search for any account updates where the previous value of the ‘AccountEnabled’ field was ‘true’.
"ModifiedProperties": [
    {
      "Name": "AccountEnabled",
      "NewValue": "[\r\n  false\r\n]",
      "OldValue": "[\r\n  true\r\n]"
    },
]
As you can see from my screenshot below, there is this field in the normalized log which outputs the previous value, but when querying under the same timeframe after clicking on that specific field, the query shows 0 logs.
Is this something I’m doing wrong, is this a bug with how the search query is interpreting it or is it a normalisation issue?

Field that I’m interested in searching for (with the matching value) 
Clicking the field and searching with this query shows 0 logs. I’ve also tried re-formatting the query, but no dice. We are using the built-in Azure AD normalizer, with most of the default fields. Any ideas how I might resolve this/work around this would be great.