SIEM - Searching & Analytics
-
Searching for special characters in fields like the wildcard star "*"
When searching for special characters in field values in Logpoint just pasting them in a regular
Key = value
expression, can often result in searches not working as intended from the users perspective as the Logpoint search language will interpret the character differently from the intention.
For instance searching for fields with a star “*” character results in getting all results that has a value in that specific key, as Logpoint uses the star “*” as a wildcard character, which basically means “anything”.key = *will result in all logs with a field called keyInstead of using they kay value pairs to search we can use the builtin command match to find any occurrences of the value that we are looking for. In this example we will search for the star “*” frequently referred to as wildcard.
We have some logs that have a field called policy in which we would like to find all occurrences of the character star “*” . To do this we first ensure that the policy field exists in the logs that we search by adding the following to our search:
policy = *
Next we want to use the command called match, which is a command that can be used with the process command eval. If we read on the docs portal (Plugins → Evaluation Process Plugin → Conditional and Comparison Functions) we can see that the match command takes a field and a regex and output a true or false to a field:
| process eval("identifier=match(X, regex)")In above example:
- identifier is the field to which we will return the boolean value true or false. This can be any field name that is not currently in use e.g. identifier or has_star
- match is the command
- X is the field that we want to find the match in
- regex is where we copy our regex surrounded by single quotes ‘’
So with this in mind we just need to create our regex, which can be done with your favourite regex checker. copy a potential value and write the regex. In this case we wrote the following regex which basically says match any character including whitespace until matching a star character *, then match any character including whitespace after. This regex match the full field value if there is 1 or more stars “*” in it.
.*\*.*Now we just need to add it to our search and do a quick chart to structure our results a bit. The search will look like the following
  "policy"="*"


  | process eval("has_star=match(policy,'.*\*.*')")


  | chart count() by policy, has_star
The search results can be seen for below:
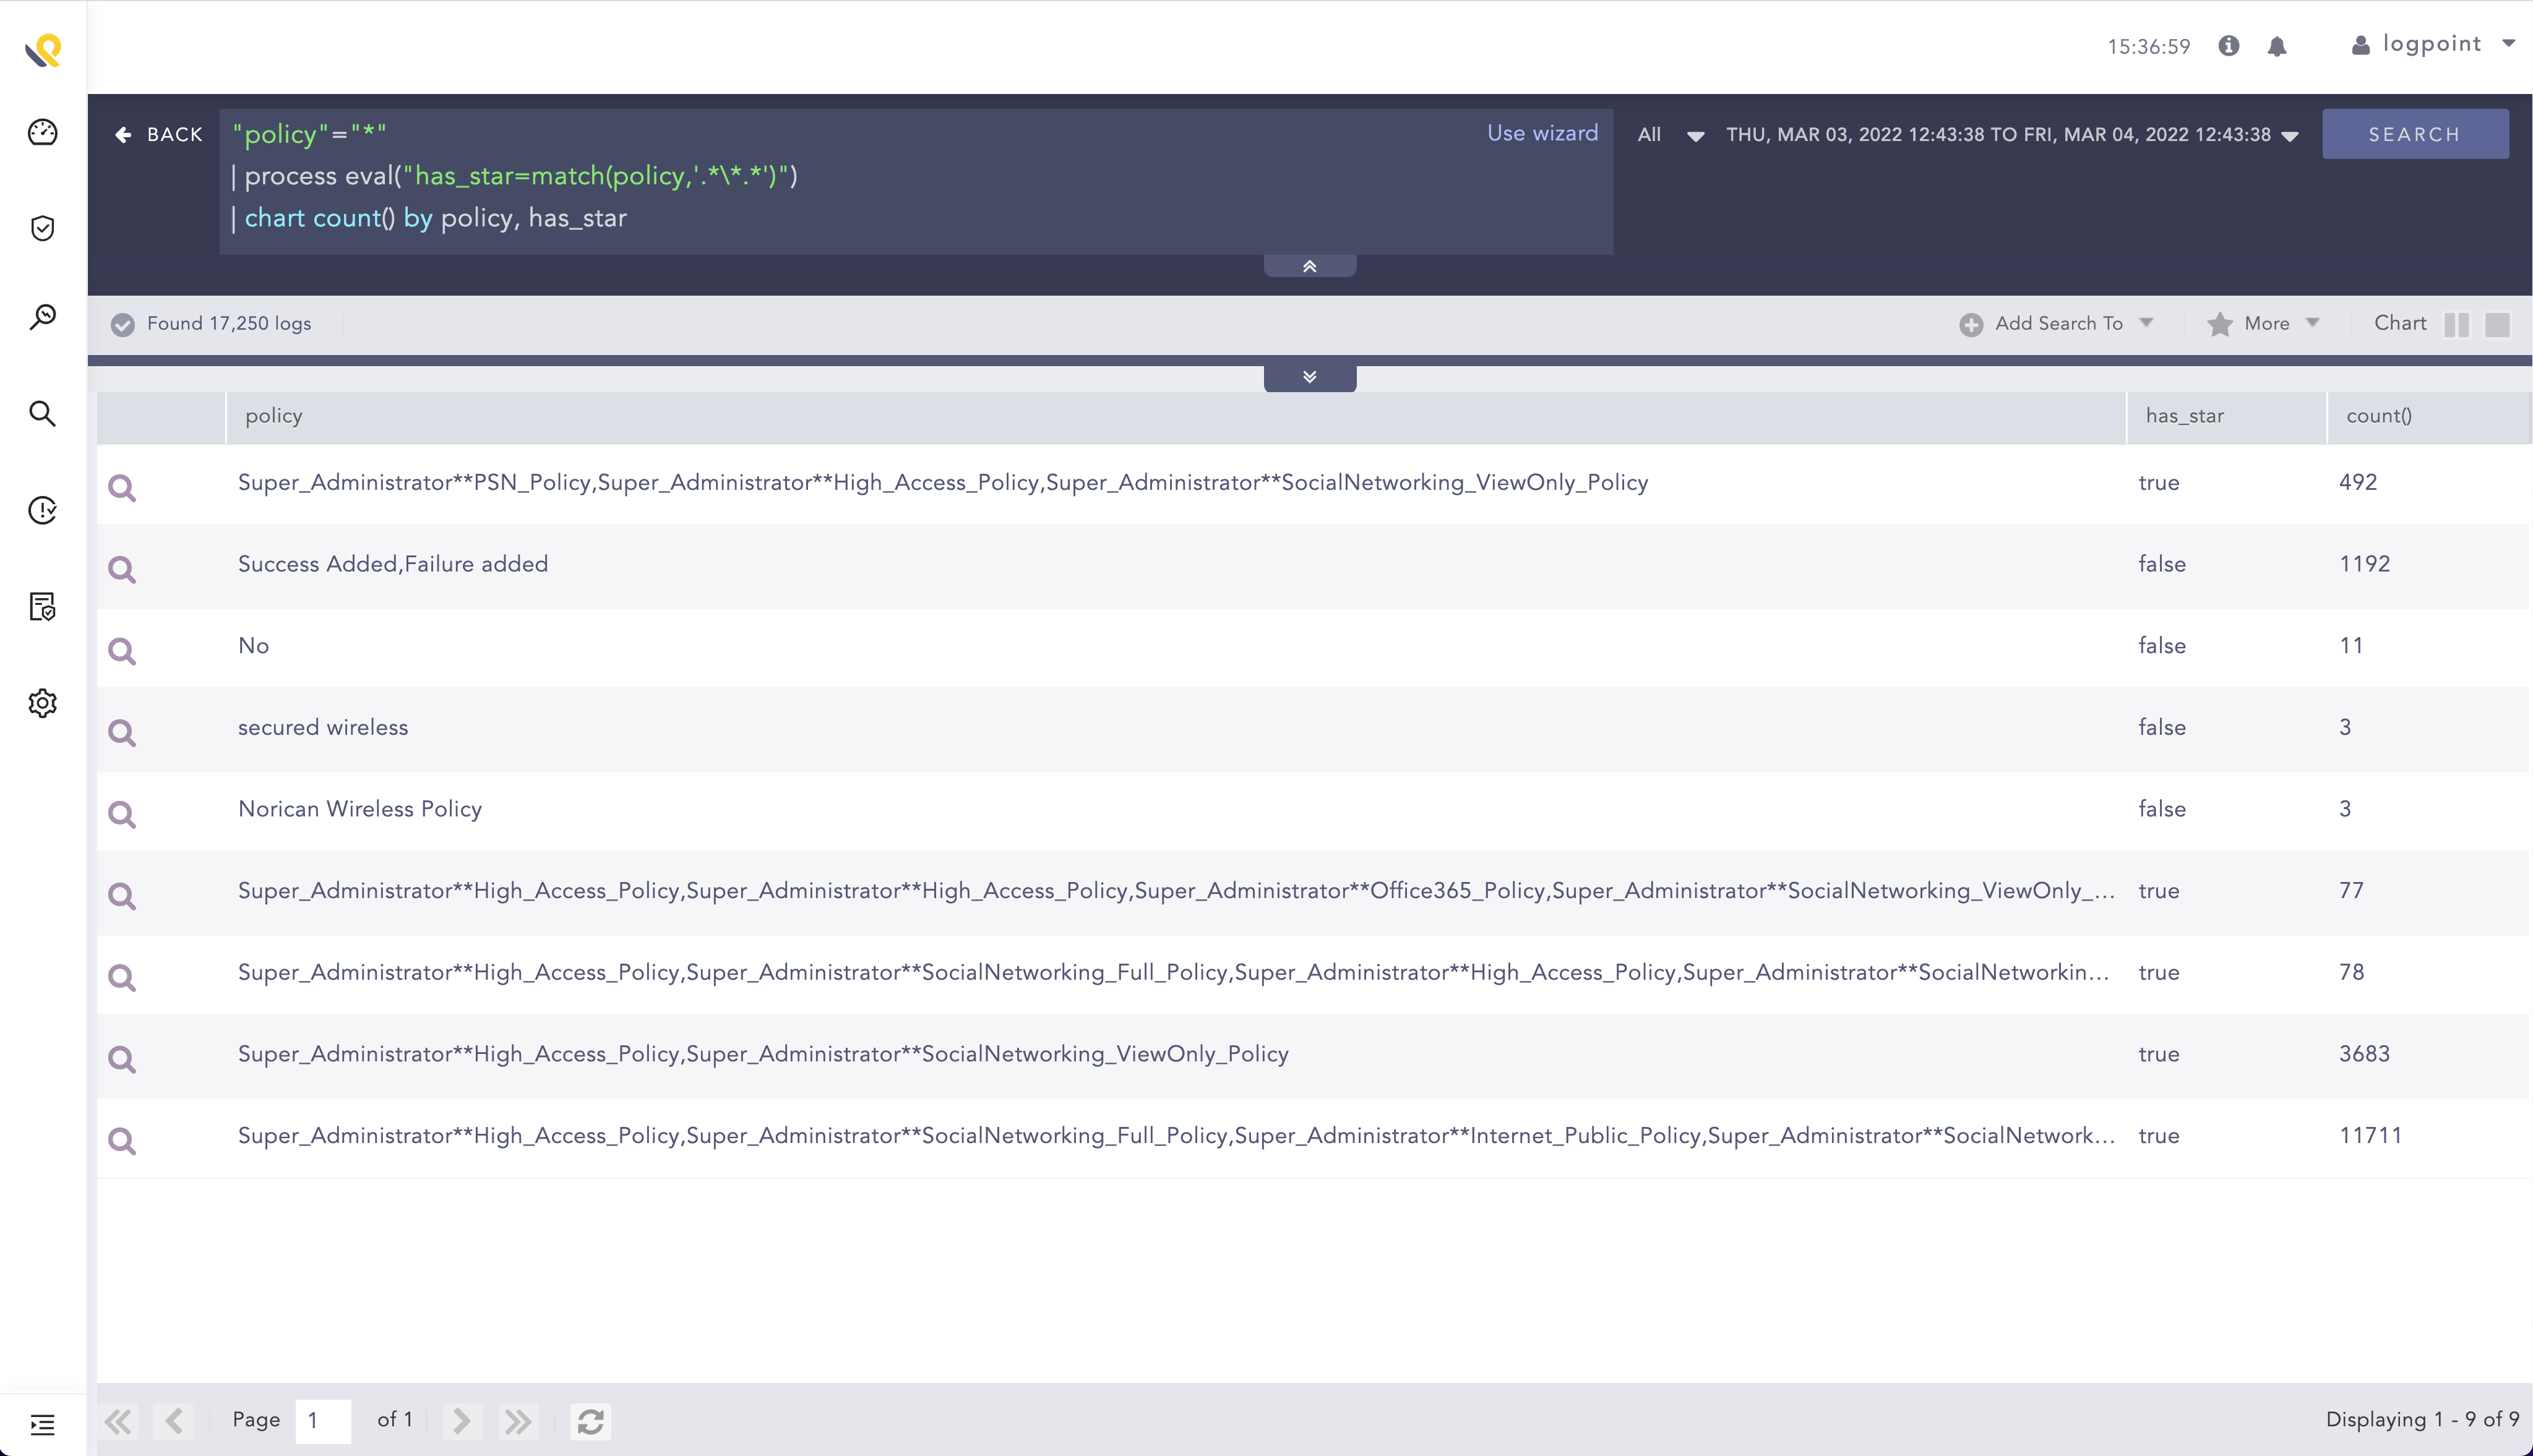
From here a simple filter command can be used to filter on results with the star in the policy field by adding
| filter has_star=trueThe search can also be used to match other things that are not special characters, e.g. finding logs with a field that starts with A-E or 0-5.
-
How to correlate more than 2 lines of logs?
We have a Cisco IronPort which is analyzing emails.
Each email analysis process generates multiple lines of logs that can be related to each other by a unique id (the normalized field “message_id”).
However, i am now lacking ideas how i can correlate more than two log lines e.g. with a join.My goal is to first search for logs where the DKIM verification failed. after that I would like to see ALL log lines that contain the same message_id as the first "DKIM" log line. The number of log lines can vary.
Here are some of my approaches, which unfortunately do not give the desired result:
[message="*DKIMVeri*"] as s1 join [device_ip=10.0.0.25] as s2 on s1.message_id = s2.message_idThis only retruns two log lines, not all matching s1.message_id = s2.message_id. Also a “right join” doesn’t work, even when the documentation indicates it .
[4 message="*DKIMVeri*" having same message_id]“having same” needs to specify the exact amount of logs, while this information is unknown. Furthermore, a result is returned, where only the normalized fields behind the "having same" clause are further usable, not those of the found events. Also the filter “message” here breaks the whole concept.
Do you have any ideas how to solve the issue?
-
How to restrict incident content to one event?
Hi folks,
When one sets up an alert, all the rows matching the search are sent to the alert. I have a use case where it is counterproductive to be able to track SLA and customers impacted. Basically, we’re concentrating all EDR alerts from many platform in one repo and want to trigger an incident by event.
I fear the limit parameter will hide other events. And playing with both limit and time range seems not deterministic.
Does anyone know how I could achieve 1 incident by row returned in the alert search?
Thanks
-
RegEx in fulltext search?
I want to search an absolute windows path name to NOT start with A, B, C drive letters.
I tried queries like this:
path in ['[D-Z]:\\*']but this doesnt work. Any ideas?
-
Microsoft Dynamic NAV application
Hey,
We have a requirement for analysing Microsoft Dynamics 365 logs. My understanding is that Dynamic NAV is now Dynamic 365 Business Central.
In this case, the log source will be coming from Microsoft Dynamics 365 Sales Enterprise. Does anyone know or have any experience of using this LogPoint application, and will it parse the logs properly?
Many thanks,
-
nested joins in queries
Hello,
I am trying to automate getting some statistics I have to report to the executive relating to the number of resolved and unresolved alerts we are dealing with as a security team.
I’m starting with the the alerts out of Office 365 as I thought that might be easier. The end goal being to aggregate the alerts from a number of different sources and either provide a regular report or dashboard for the executive. However I am starting small.Getting the number of resolved alerts is fairly straightforward
norm_id="Office365" label="Alert" status="Resolved" host="SecurityComplianceCenter" alert_name=* | chart count()however getting the unresolved alerts is not quite as easy. My initial test involved negating the status field in the query above. Whist this gave a result, it was not very accurate.
The problem appears to be that the status can be in one of 3 states, “Active”, “Investigating” or “Resolved”, so my first attempt was counting multiple log entries for the same alert.
After some more experimentation I have come up with
[norm_id="Office365" label="Alert" -status="Resolved" host="SecurityComplianceCenter" alert_name=*] as search1
left join
[norm_id="Office365" label="Alert" status="Resolved" host="SecurityComplianceCenter" alert_name=* ] as search2
on search1.alert_id = search2.alert_id | count()
This sort of works and the result is more accurate, but still very different to what Office 365 shows.
I think I need to check that an entry with an Active or an Investigating state only counts once for the same alert_id before it is checked against whether there is a corresponding resolved entry for that alert_id
I am not sure how to achieve this, whether it would need a nested join, or whether nested joins are even possible.
Any hints, or better ways of achieving this would be greatly appreciated.
Thanks
Jon
-
McAfee ePO - Some logs are not normalized
Some logs coming from MCAfee ePo server are not being normalized. At first glance it seems that MCAfee introduced a new log type regarding PrintNightmare which LP does not recognize. I asked the customer and he indeeed uses McAfee to prevent users from installing new print drivers.
We are using LP 6.12.02 and McAfee application 5.0.1. The normalization policies include
- McAfeeEPOXMLCompiledNormalizer
- LP_McAfee EPO XML
- LP_McAfee EPO Antivirus
- LPÜ_McAfee EPO Antivirus DB
- LP_McAfee EPO Antivirus DB Generic
Just added McAfeeVirusScanNormalizer. Maybe this will do the trick
Example log (i replaced some information with REMOVED BY ME)
<29>1 2022-01-24T06:52:07.0Z ASBSRV-EPO EPOEvents - EventFwd [agentInfo@3401 tenantId="1" bpsId="1" tenantGUID="{00000000-0000-0000-0000-000000000000}" tenantNodePath="1\2"] ???<?xml version="1.0" encoding="UTF-8"?><EPOevent><MachineInfo><MachineName>REMOVED BY ME</MachineName><AgentGUID>{a231b576-9e3a-11e9-2dbc-901b0e8e1ab2}</AgentGUID><IPAddress>REMOVED BY ME</IPAddress><OSName>Windows 10 Workstation</OSName><UserName>SYSTEM</UserName><TimeZoneBias>-60</TimeZoneBias><RawMACAddress>901b0e8e1ab2</RawMACAddress></MachineInfo><SoftwareInfo ProductName="McAfee Endpoint Security" ProductVersion="10.7.0.2522" ProductFamily="TVD"><CommonFields><Analyzer>ENDP_AM_1070</Analyzer><AnalyzerName>McAfee Endpoint Security</AnalyzerName><AnalyzerVersion>10.7.0.2522</AnalyzerVersion><AnalyzerHostName>GPC2015</AnalyzerHostName><AnalyzerDetectionMethod>Exploit Prevention</AnalyzerDetectionMethod></CommonFields><Event><EventID>18060</EventID><Severity>3</Severity><GMTTime>2022-01-24T06:48:33</GMTTime><CommonFields><ThreatCategory>hip.file</ThreatCategory><ThreatEventID>18060</ThreatEventID><ThreatName>PrintNightmare</ThreatName><ThreatType>IDS_THREAT_TYPE_VALUE_BOP</ThreatType><DetectedUTC>2022-01-24T06:48:33</DetectedUTC><ThreatActionTaken>blocked</ThreatActionTaken><ThreatHandled>True</ThreatHandled><SourceUserName>NT-AUTORITÄT\SYSTEM</SourceUserName><SourceProcessName>spoolsv.exe</SourceProcessName><TargetHostName>REMOVED BY ME</TargetHostName><TargetUserName>SYSTEM</TargetUserName><TargetFileName>C:\Windows\system32\spool\DRIVERS\x64\3\New\KOAK6J_G.DLL</TargetFileName><ThreatSeverity>2</ThreatSeverity></CommonFields><CustomFields target="EPExtendedEventMT"><BladeName>IDS_BLADE_NAME_SPB</BladeName><AnalyzerContentVersion>10.7.0.2522</AnalyzerContentVersion><AnalyzerRuleID>20000</AnalyzerRuleID><AnalyzerRuleName>PrintNightmare</AnalyzerRuleName><SourceProcessHash>b0d40c889924315e75409145f1baf034</SourceProcessHash><SourceProcessSigned>True</SourceProcessSigned><SourceProcessSigner>C=US, S=WASHINGTON, L=REDMOND, O=MICROSOFT CORPORATION, CN=MICROSOFT WINDOWS</SourceProcessSigner><SourceProcessTrusted>True</SourceProcessTrusted><SourceFilePath>C:\Windows\System32</SourceFilePath><SourceFileSize>765952</SourceFileSize><SourceModifyTime>2020-07-08 08:54:39</SourceModifyTime><SourceAccessTime>2021-03-05 10:58:36</SourceAccessTime><SourceCreateTime>2021-03-05 10:58:36</SourceCreateTime><SourceDescription>C:\Windows\System32\spoolsv.exe</SourceDescription><SourceProcessID>2852</SourceProcessID><TargetName>KOAK6J_G.DLL</TargetName><TargetPath>C:\Windows\system32\spool\DRIVERS\x64\3\New</TargetPath><TargetDriveType>IDS_EXP_DT_FIXED</TargetDriveType><TargetSigned>False</TargetSigned><TargetTrusted>False</TargetTrusted><AttackVectorType>4</AttackVectorType><DurationBeforeDetection>28068597</DurationBeforeDetection><NaturalLangDescription>IDS_NATURAL_LANG_DESC_DETECTION_APSP_2|TargetPath=C:\Windows\system32\spool\DRIVERS\x64\3\New|TargetName=KOAK6J_G.DLL|AnalyzerRuleName=PrintNightmare|SourceFilePath=C:\Windows\System32|SourceProcessName=spoolsv.exe|SourceUserName=NT-AUTORITÄT\SYSTEM</NaturalLangDescription><AccessRequested>IDS_AAC_REQ_CREATE</AccessRequested></CustomFields></Event></SoftwareInfo></EPOevent>
-
LP Alert rule correct ? (LP_Windows Failed Login Attempt using an Expired Account")
Hello,
i am currently taking a look at the alert rules shipped with LogPoint trying to figure out which of these are applicable to our environment, and sometimes find something i think (keep in mind, i am neither an expert reagrding LogPoint nor InfoSec) is not correct. I do not know whether LogPoint has any bug tracker i can post\ask for clarification.
E.g.
Alert rule - LP_Windows Failed Login Attempt using an Expired Account (LP 6.12.2)
“This alert is triggered whenever user attempts to login using expired account.”
The search query isnorm_id=WinServer* label=User label=Login label=Fail sub_status_code="0xC0000071" -target_user=*$ -user=*$ -user IN EXCLUDED_USERS | rename user as target_user, domain as target_domain, reason as failure_reason Asa far as i understand the Windows documentation ( 4625(F) An account failed to log on. (Windows 10) - Windows security | Microsoft Docs ), the substatus 0xC000071 means the login was attempted with an expired password , not with an expired account , which would be 0xC0000193.
So shouldn’t the search query use the substatus 0xC000193, or am i missing something ? (I do not see the big impact a login attempt with an expired password has, while i would like to be alerted when an expired account tries to login).
Another question:
I would like to know what “label=User label=Login label=Fail” (or any other shipped label) actually decodes to. However, i can not find the search package for the Windows labels to take a look how these search labels are “decoded”.
-
[HOW TO] MPS per repo and per log source
Hello all,
I would like to visualize:
 MPS sent by each log sources
 MPS per repo_name
I have managed to create a timechart of MPS per repo_name:
repo_name=* | timechart count() by repo_name
Note : This is not really MPS per repos, but log volume per repo.
But I cannot find how to generate the equivalent for each log sources.
Thanks for your help!
-
Getting false alerts for inactive devices
Hello,
to get noticed when a device is no longer sending logs i created an alert that uses this search query:
device_ip in DG_AKTIVE_GERAETE | chart count() by device_name,device_ip | search 'count()' = 0
(AKTIVE_GERAETE is a device group i put all the devices in that should be monitored).
The alert runs every two hours and nearly every day at the same time (1am) i get an alarm per email that one of our firewalls didn’t send logs. I am pretty sure that is a false positive .
However, when clicking of the link in the email, i indeed see a hit.
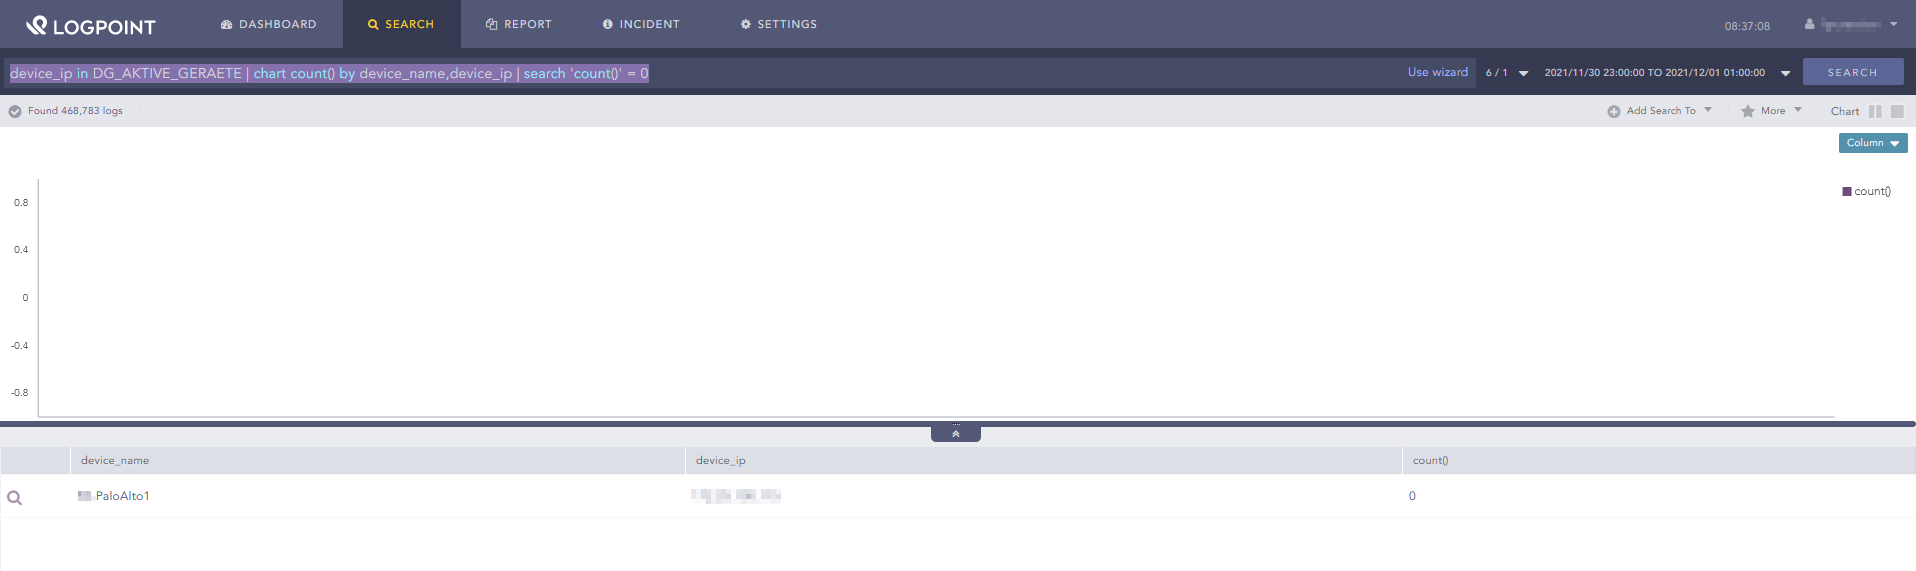
False alert But when searching again by clicking on search, there isn’t a hit anymore.
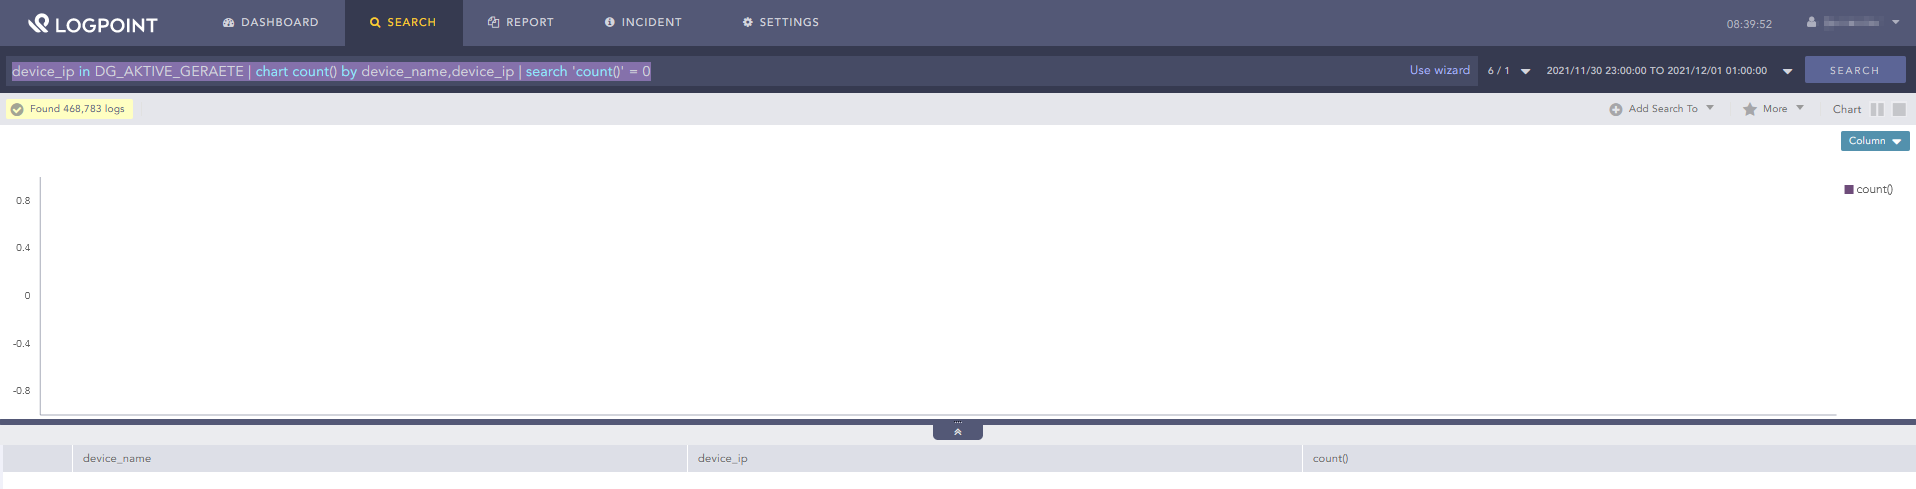
Displaying all logs from this device for the last 24 hours also does not show any missing logs for this time
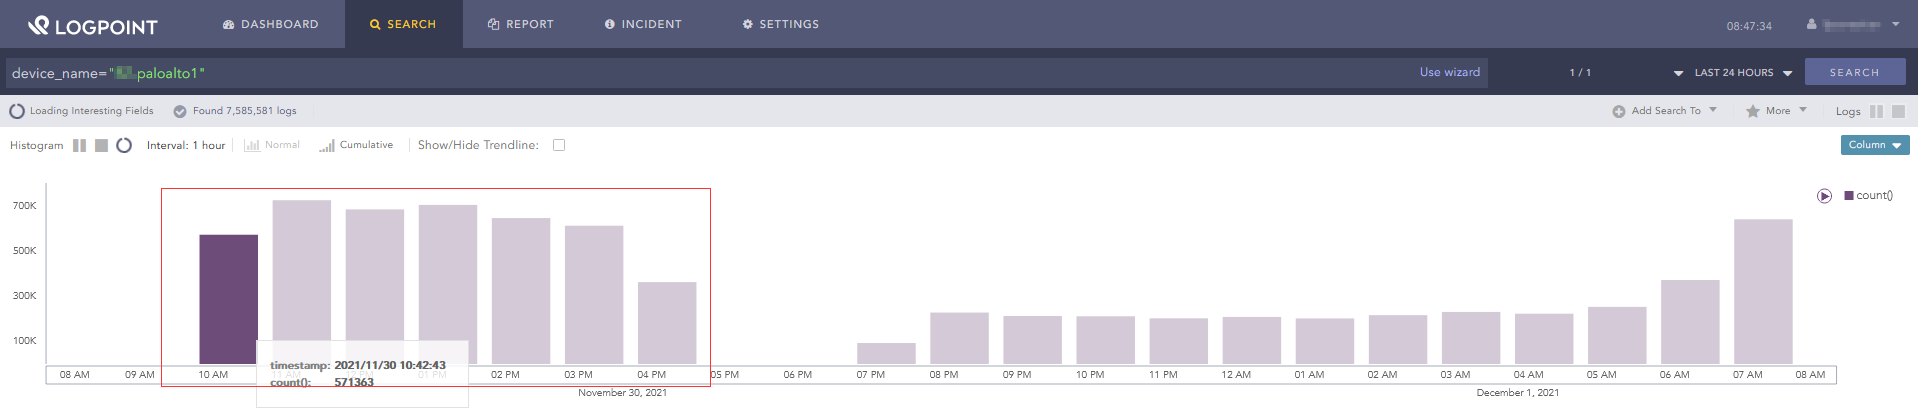
So, as i said, pretty sure it is a false positive.
The alert is always triggered for the same device and always for the same timeframe (23pm and 1am) , so i was thinking that the LP wants me to somehow acknowledge it before stopping to trigger it. But i already marked and closed all incidents of the alarm at one point, but the next day the alarm was triggered again.
Here is the configuration of the alert:
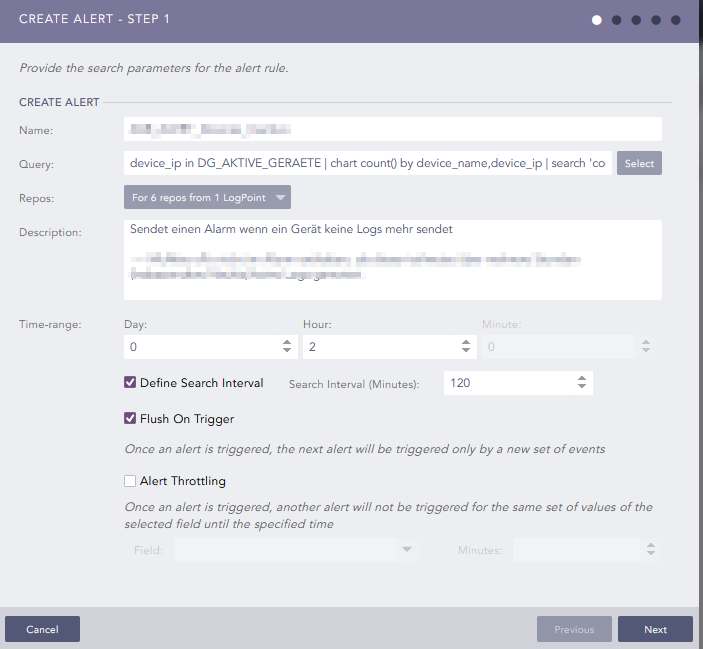
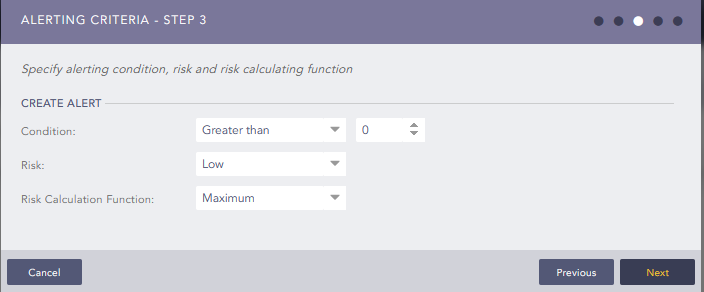
Anybody got any ideas ? Am i missing something ? I know the next LP version will have the detection of inactive device “build in”, but i am curious what is going on here.
Andre
-
Updating of Applications
Hi,
I’m trying to find some information about updating applications. I have, for example, the Office365 application at version 5.0.1, and want to update it. This is on a production LP. What is the update process for applications/plugins?
Many thanks
-
Is it possible to share alert rules from "Used Rules"?
I’ve implemented some alerts by using Vendor Rules (via the “Use” action) and customizing them. But there is no action to share or change ownership of rules in the “Used Rules” view. Is it generally impossible to share those rules?
Maybe I don’t quite understand the purpose of “Used Rules”, shouldn’t the vendor rule by under “My Rules” once it has been customized?
-
Email Alerts search-link
Hi There!
Is there a way to have my logpoint server to use its url name instead of IP-address in the alert-mail search-link?
regards Fredrik
-
How to see a result whith "filter < ..."
Hi,
every hour my firewall loads a new antivir database. In normal case, I receive 24 logs a day. When the download fails, I don’t receive any log.
Now I want to be informed when the count of logs are less than 20 a day.
I tried the following:
norm_id=FortiOS event_category=kevent sub_category=update message="Update result: virus db:yes*" | chart count() as "Count" by message | filter "Count" < 20
but this query doesn’t show my any results. I would like to see message and Count.
What should I modify?
Best regards,
Hans Vedder
-
Using geoip at drilldown
Hi,
at
Kalyan Bhetwal provided the following query:
norm_id=* destination_address=* -destination_address in HOMENET | chart count() by destination_address, country order by count() desc limit 10 | process geoip(destination_address) as country
To my comment “With the ‘new’ query it's not possible to make a drill down.” he wrote:
We will have a new feature in upcoming version of logpoint where the geoip used after chart count() will also be present in drilldown. This will solve the drilldown problem.
What about the new feature? At the moment, it’s still not possible to make a drill down.
I use Logpiont 6.12.1.
Best regards,
Hans Vedder
-
Join: Restricting "followed by" using time conditions
Hello,
i am facing following scenario:
I want to monitor web gui access to a device, especially the host a access was attempted from. However, most of the access attempts are done from different LANs, using web proxies. Hence, i only see the ip of the web proxies as the source ip of the login attempts.
I therefore like to use some kind of join to retrieve access attempts to the device, and then check the web proxies which ip was accessing the device IP at around that time (e.g. within two seconds). (I tried a join based on the exact same time, but this approach leaves out many events).So basically, i need something like
[search1] as s1 followed by [search2] as s2 on s1.log_ts <= s2.log_ts + 2 seconds
Does any body know how i can accomplish this, or knows of a different approach ?
Andre
-
Why this query is wrong?
Hi,
when I start a query
| chart min(log_ts) as min_ts by min_ts, source_address, destination_address
I receive the error message:
could not convert string to float: '/'.
But why?
An example for log_ts: 2021/10/11 11:04:54
I use
| chart count() as "Count", min(log_ts) as min_ts, max(log_ts) as max_ts
in a macro and I am sure that in fewer versions of Logpoint I didn’t receive this error message.
Actually I use Logpoint version 6.12.0
Best regards,
Hans Vedder
-
Creating Alert Rules PAK File
HI,
i want to integrate many of the SIGMA Rules found here:
https://github.com/SigmaHQ/sigma
I was able to translate them into the Logpoint Query Language and Now i want to Import them as Alert Rules.
Doing each one by one manually in the GUI is a very time consuming/impossible Task.
Is there a Way to Import Alert Rules beside the .PAK Files? Or is there a Defintion how such a .PAK File looks?
Best Regards
Timo
-
Is it possible to create a device group with devices on a remote LP ?
Hello,
as the title says i was wondering whether devices that are configured as a log source on a remote LP can be added to a devices group configured on the local LP?
Our network is divided into two locations connected via a MPLS connection, and to prevent devices sending their logs over the MPLS line we configured a LP at each location and added one LP as a remote LP into the other LP (our “main LP”).
I would like to create an alert on our “main LP” to notify us when a deviceis no longer sending logs. Hence i would like to create a device group on the “main LP” containing all the devices the alert should “monitor”, but i am unable to add devices that are configured as log sources on the remote LP. As far as i understand the documentation, it is possible when using LP Director (which we do not have), but not possible in our scenario. Just would like to confirm this and that i have to create an altert on both LP monitoring the “local” log sources.
-
More Fields in Stream Search with "having same"?
When I'm using a search query like this:
[5 event_id=1234 having same user]I'm getting a grouped result with only log_ts and user as normalized fields for this group.
Is it possible to get more fields similar to SQL with the
select FIELDS where CONDITIONAt the moment I'm "workarounding" this with joining the first search with another search. But this seems to be extremly inefficient because it uses the analyzer process which itself relies on slow leveldb operations:
[5 event_id=1234 having same user] as s1 join [event_id=1234] as s2 on s1.user = s2.userIs there a better solution?
The problem with 'having same' is, that the search result only contains the fields specified in the 'having same' clause. But in this special case the 'service' field should be different, not the same. So specifying it in a comma separate list (like '...having same user,service...') doesn't help here.
It would be great to access all the other fields in a following 'chart count()' etc.
-
Threat_Intelligence
My Endpoint devices shows source_address as client_ip? How can I use threat_intelligence for matching source_address as client_ip? I have used rename for enrichingthose threat_intelligence logs, but failed to do so?
How can I use endpoint hashes as well for enriching threat_intelligence logs?
-
Usage of if-else statements in eval
Hi
I can see that the process eval command supports the use of if-else statements, but I can’t find any examples of the syntax.
My issue is that I have logs which contain a source_address field, and host_address, and then I have some other logs which only contains host_address logs, and I would like to translate the IP to country from source_address if the field exists and else take it from host_address. So I tried to say if, source_address is null, then set source_address to host_address, else nothing.
|process eval(if(source_address=null, source_address=host_address,) -
Detecting devices not sending logs
Hi
I know the following query can be used to create an alarm with devices that haven’t been sending logs
| chart count() by device_ip | search ‘count()’ = 0
However, in cases where I have multiple IP’s for a single device this won’t work as the ones not sending data will come up in the search result even though the device is sending data from another IP. Another case where I have issues, is when pulling data with for instance the O365 fetcher which will have device_ip of the localhost which will also be the case for the internal LogPoint logs. One way could be to create alerts on the individual repo’s with some specific characteristics, but I would like to avoid creating multiple alerts for the same to reduce search load.
Any ideas how to build a single alert for detecting devices not sending logs with multiple IP’s and fetchers not fetching any data? -
Using quotes " in process regex command?
I need to extract a field which is not getting normalized as it is part of a combined field. the value of the field is sounded by quote signs, but the process regex command doesn’t seem to get it when I put a backslash before the quote sign. Can I somehow escape the quotes in my regex?
Example, I want to extract the “from” field value
{
"Directionality": "Incoming",
"From": "do-not-reply@test-industry.dk",
Wrote the following regex: .*?From\"\:\s*?\"(?P<from>.*?)\"
but pasting it to | process regex(“.*?From\"\:\s*?\"(?P<from>.*?)\"”, msg) gives error and says “unbalanced quotes” -
Has anyone worked with the "step" function in Logpoint?
Hello. Just as the question mentioned. I am fulfilling a use case that requires grouping integer values in steps of maybe 4, 10, or even more. I would like to use the step function, but it is not working as per the documentation mentioned at docs.logpoint.com
Can anyone point me towards the solution to grouping values / using the step function?
-
Export raw logs
Hi, I need to export a large amount of raw logs for a device. I tried to use the export log feature but I can’t select a destination. Can someone help ?
-
Apply normalization to raw logs
I have configured a log source with the wrong normalizer and therefor the usual field extractions from LogPoint taxonomy weren’t available in the search interface. I fixed the normalizer configuration but dont’t know how apply LogPoint taxonomy on older logs. Can someone help ?
-
What is the best recommendation while calculating eps of external and internal firewalls ?
As we know the external firewall is exposed with multiple entities, the logs generated by the firewall are usually way higher than the internal firewall. Along with that application firewall, a firewall with IPS and IDS enabled might have more logs than normal.
-
Information about analytic components available for SNMP in logpoint ?
I used snmp to fetch oid ".1.3.6.1.2.1.1.5.0", while searching it shows "iso_org_dod_internet_mgmt_mib-2_1_5_0", How do i use this information to a dashboard or alert? Are there any normalizers available for this?
-
Use cases for working from home
Hi team, do we have some standard dashboards for Work From Home use cases?