Welcome to Logpoint Community
Connect, share insights, ask questions, and discuss all things about Logpoint products with fellow users.
-
NDR Solution
Hello team - Is there a technical solution document for Logpoint NDR solution (Architecture, Solution components etc.) to help me prepare a technical proposal.
-
Join Logpoint User Group!
We are excited to announce new platform for Logpoint community collaboration - Logpoint User Group! This new platform will give you an opportunity to talk with Logpoint Product team directly and share feedback with the entire community.
To read more about Logpoint User Group, as well as to sign up, please follow the link below:
https://logpoint.com/logpoint-user-group -
Integrate a use case in Logpoint for all tenants
Good morning, could anyone tell me if I can integrate a use case with its respective query in CSV or JSON so that I don't have to create them one by one in each of the client tenants? If so, could you tell me how to do it?
Thank you very much for everything.
-
Tableau Plugin
I've done a little searching, but I haven't had any luck finding a Tableau plugin.
Does one exist, or have an integration with logs from Tableau coming to Logpoint?
-
LogPoint alert bug where it doesn't use search filtering with ">" or "<" symbols
Hello,
Hope all is well,
I have encountered a bug within LogPoint alert rule queries were all default and custom alert rules that utilise symbols ">" or "<" to finalise alert logic fails to use these symbols and all other data that was added after those symbols. If you run the alert rule query by copy pasting it to the search manually, it works as it should, but if you want that query to be used by an alert (alert query) it drops everything that is beyond and including the symbols "<" or ">".
Example of this bug:
Multiple default LogPoint alerts utilise end of alert logic with filtering command similar to this "| search Event>10" but once the query is executed by the alert itself this filtering command is being cut and is executed as "| search Event" that produce incorrect results.This seams like a straight forward bug that LogPoint support should be aware of, is there a fix for it? any workarounds?
Appreciate the support,
-
Data Not Showing on AgentX Dashboard
Hi All,
Has anyone else experienced the same issue? I'm receiving AgentX logs, and everything seems to be working fine, but I can't see any data on the AgentX dashboard. I've also selected the correct repository.
-
SNMP values for repos?
Hi,
We are looking into setting up SNMP monitoring and are a bit confused of the values in the fetch.
For instance this SNMP value, is it in MB, MiB or anything else?
1.3.6.1.4.1.54322.1.13.2 Log size of repos in the previous dayIt is not specified on the documentation side:
https://docs.logpoint.com/docs/system-configuration/en/latest/System/System%20Monitor.html#snmp-monitoring -
Search for IP Range
Hi Everyone,
Was wondering if it's possible to search for an IP range among logs collected.
For example I might want to search for anything between 10.0.0.1 and 10.0.0.50 which would make investigations easier instead of searching for individual IP's.
Thanks in advance. -
Request for information on the API Access URL
Hi,
Could you please tell me how to find the access URL for the Logpoint API ?
Thank you in advance.
Regards,
Siawash
-
New training platform and events calendar
Logpoint is happy to announce an update to Certified Logpoint training. Please see all upcoming session on logpoint.com under events and have a look at our new training platform Logpoint Academy 🤗
On Logpoint Academy you will find some free content and if you have purchased training and received a redemption code from your sales representative, this is the place to enter to unlock your next training course!
-
distinct_count and followed by Issue while fetching Azure AD sign in logs
Office365 logs are sending duplicate events. So the generic usecase doesnt really work
[10 label=User label=Login label=Fail having same user] as s1 followed by [label=User label=Login label=Successful] as s2 on s1.user = s2.user
[col_type=office365 label=User label=Login label=Fail | chart distinct_count(id) as CNT by user | filter CNT>2] as s1 followed by [col_type=office365 label=User label=Login label=Successful] as s2 on s1.user = s2.user | chart count() by s2.log_ts,s2.user
Here "id" represents request id in azure AD, which is unique and thats what i want.
- Even if there isn't any output from s1, still I get some result from total query
- Also, i dont exactly get the followed by event, i get all success events in the timeframe
-
Unable to see some Pre-configured Playbook Guides
Hi,
I cannot see following Pre-configured Playbook Guides https://docs.logpoint.com/soar?p=Logpoint&page=Pre-configured%20Playbook%20Guides .
-
Brute Force Detected - Multiple Unique Sources Playbook
https://docs.logpoint.com/docs/brute-force-detected-multiple-unique-sources-playbook/en/latest/ -
Credential Dumping - Registry Save Playbook
https://docs.logpoint.com/docs/credential-dumping-registry-save-playbook/en/latest/ -
Default Brute Force Attempt Multiple Sources Playbook
https://docs.logpoint.com/docs/default-brute-force-attempt-multiple-sources-playbook/en/latest/ -
Password Spray Playbook
https://docs.logpoint.com/docs/password-spray-playbook/en/latest/ -
PsExec Tool Execution Detected Playbook
https://docs.logpoint.com/docs/psexec-tool-execution-detected-playbook/en/latest/
All links direct to the page showing
Permission Denied
You don't have the proper permissions to view this page. Please contact the owner of this project to request permission.How can I see these pages?
Best,
Kaz
-
Brute Force Detected - Multiple Unique Sources Playbook
-
Search query for vulnerability score divided into three different levels.
HI,
We are using the Rapid7 fetcher and with the score field I want to make a widget where we divide these score into three different levels namely:
- Low with a score between 0 and 600.
- Medium with a score between 600 and 800.
- High with a score between 800 and 1000.
My issue is that I can't find the right search query to let me see this data the way I explained. I hope you may know the right query I need to use to get the result of the divide levels to work.
Thanks in advance.
-
File moved and File deleted
Hello Logpoint Community!
I’ve recently begun with the process of trying to create a search template to look up a user, and see recently moved files, or recently deleted files. I’m assuming this needs to be two seperate templates.
Anyhow, when browsing the file audit logs, I was baffled at the amount of logs generated by moving one file. In our environment, when moving one file, it generates upwards of 14 log entries, all with actions like “requested”, “access” - some log entries have the path of the file, some don’t.
Anyways, before I commit what I assume would be a long time trying to create this from scratch, I was wondering if some of you would be able to share a template to look up files moved by a user.In my mind it would look something like this.
| Timestamp | Username | File_path_old | File_path_new |
Any help at all would be appreciated!
Thanks in advance
-
Correlate target_id and target_user
Is there an easy way to correlate the target_id and target_user for Windows events that do not have a target_user value?
For example: what a user is added to a group, only the target_id is displayed in the event, but we also want to show the target_user in the event or dashboard. -
LogPoint pySigma Backend
Hi
Just to draw your attention to this new tool.
Though still in preliminary stage, certainly worth trying.
-
Playbook not executed when alert is triggered
Hello,
I am trying to set up the launch of a plugin when an alert is triggered.
My alert appears to be working correctly; I receive an email every time it is executed.According to the documentation, I've set up the trigger on my Logpoint search node like this:
SELECT * FROM LogPoint WHERE alertrule_id = 'xxxxxxxxxxxxxxxxxxx' OR name = 'Detection of a Threat 2'
I have also tried SELECT * FROM LogPoint WHERE alertrule_id LIKE '%xxxxxxxxxxxxxx%'
Unfortunately, when an alert is triggered, the playbook is not executed.
Do you have any idea what might be causing this issue? Am I missing something?
Regards,
Julien -
Running LogPoint as Docker Container
I just managed to run LogPoint as a docker image/container.
It is relatively simpel and could help improving testing systems, where you want to start from a fresh logpoint for each test, make the desired configurations, run the test and discard the changes at the end.
Our use case was developing a unit testing framework for alert rules.
- Spin up the docker container
- Configurate repo, routing policy, normalization policy, processing policy, device and syslog collector
- Configurate the alert rule to test (test object)
- Send some pre-defined logs via syslog to the docker-logpoint
- Wait pre-defined time to see if the behaviour of the alert rule is as expected (triggers or doesn’t trigger)
- Stop the docker container, discarding all changes (configuration, log storage, etc.)
- Repeat with the next test scenario
Here is what I did to run logpoint in a container. I did this on a linux machine (debian 12) with docker.io installed:
- Download latest OVA (here logpoint_7.4.0.ova)
-
Extract the OVA (which is a tarball at all)
-
tar xf logpoint_7.4.0.ova
-
-
Convert the VMDK disk image to a raw disk image with qemu-img
-
qemu-img convert -O raw LogPoint-7.4.0.vmdk LogPoint-7.4.0.raw
-
-
Figure out the start position of the LVM partition in the disk image
-
parted -s LogPoint-7.4.0.raw unit b print - Look for the start number of the 4th partition, copy it without the “B” at the end
-
-
Create a mountpoint where you mount the LVM partitions to
-
mkdir /mnt/rootfs
-
-
Create a loop device stating at the 4th partition postition we got from parted
-
     losetup -o

      <START POSITION>

     -f LogPoint-7.4.0.raw
-
-
Mount the LVM LVs to our mountpoint
-
mount /dev/LogPoint-vg/root /mnt/rootfs/ -
mount /dev/LogPoint-vg/application /mnt/rootfs/opt/ -
mount /dev/LogPoint-vg/app_store /mnt/rootfs/opt/makalu/app_store/ -
mount /dev/LogPoint-vg/storage /mnt/rootfs/opt/makalu/storage/
-
-
Compress the whole filesystem into a gzip compress tarball for docker import
-
tar -czf image.tar.gz -C /mnt/rootfs/ .
-
-
Import the tarball as docker image
-
docker import image.tar.gz logpoint:7.4.0
-
-
Get the new logpoint docker image ID
-
docker images
-
-
Spin up a container and run an interactive shell inside the container
-
     docker run --security-opt seccomp=unconfined --privileged --ulimit core=0 --ulimit data=-1 --ulimit fsize=-1 --ulimit sigpending=62793 --ulimit memlock=65536 --ulimit rss=-1 --ulimit nofile=50000 --ulimit msgqueue=819200 --ulimit rtprio=0 --ulimit nproc=-1 -p 8443:443 -p 8514:514 -p 822:22 -i -t

      <IMAGE ID>

     /bin/bash
-
-
Switch to the new less memory consuming shenandoah Java GC
-
sudo -u li-admin /opt/immune/bin/li-admin/shenandoah_manager.sh enable
-
-
Start the logpoint processes
-
/opt/logpoint/embedded/bin/runsvdir-start
-
I hope this helps some of you!
-
ChatGPT integration
Im trying to integrate chatgpt with logpoint and the chatgpt plug in files that i found on the logpoint website are json files. When I tried upladoing them it says that logpoint plugins font support json files. Has anyone been in a similar situation and/or know what to do.
Thankyou -
Adding IP into LIST
Hi folks,
How can I add IP into LIST in playbook?
I have created playbook where I am extracting malicious IP and want to add into LIST(SOAR). It would be great if someone have idea which node I should use or any other way?
-
search current hash of kaspersky into logpoint
we need to search hash in logpoint of our current endpoint and servers. how we can do that. is there any package we need to install for particular application or anything else
also we have edr kaspersky and imported its package in logpoint. we are getting teh windows logs only nott he hashes from kaspersky. we need to configure to recieve hashes from kasper sky
-
search current hash into logpoint without adding or connecting with threat feeds
we need to search hash in logpoint of our current endpoint and servers. how we can do that. is there any package we need to install for particular application or anything else.
-
How to extract user from regex in search?
Hello folks,
I am attempting to extract data for users who have browsed torrents. I've applied a regex query to match users, but it's returning all users instead of only those matching the regex.
Here is a query : "user"=* application=bittorrent | process regex("^[a-zA-Z]\.[a-zA-Z]+\d*\.\d{2}$",user )
If anyone know what I am missing, love to hear.
Thanks
-
【Japanese language support】We can provide/support Japanease language menu
Dear Team,
Since we need to prepare Japanese Web UI we want to provide it then please incorporate into your source code.
Japan’s market is really needed to support our own language.
Kindly understand our situation and cooperate with it.
Could you do that?
regards,
Yoshihiro
-
Has anyone tried getting log data from Topdesk in paticulare auditdata
This is a cloud services and looking for a solution to get data to our onprem LP servers.
Regards Kai
-
Change timestamp on incoming logs
Hi!
I’ve several logs that comes in UTC timeformat. My timezone Is UTC + 2. Which mess things up when I perform querys, hunting, analyzing events and taking out reports.
My log Exporters often send syslog in UTC timeformat, RFC-compliant behavior.
Is It possible to apply any sort of Normalization Package for these incoming logs to fix this?
Can I try with some querys that changes the log_ts & col_ts field to UTC +2 timezone? Instead of the default UTC timezone.
Thanks -
FileShare missing logs
Hi,
I need you help form an issue that I have about the FileShare logs. In fact, when a user download the files form fileShare I didn’t have any log to shows downloaded file. In fact I receiving juste the “ sycnhronisation ” logs :
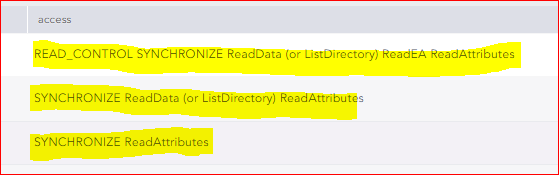
Could you please tell me how can I do to receive the logs from fileshare to show when a user download or copy file ?
Thank you in advance for your help :)
Regards,
Siawash
-
Why this error message ?
Hi,
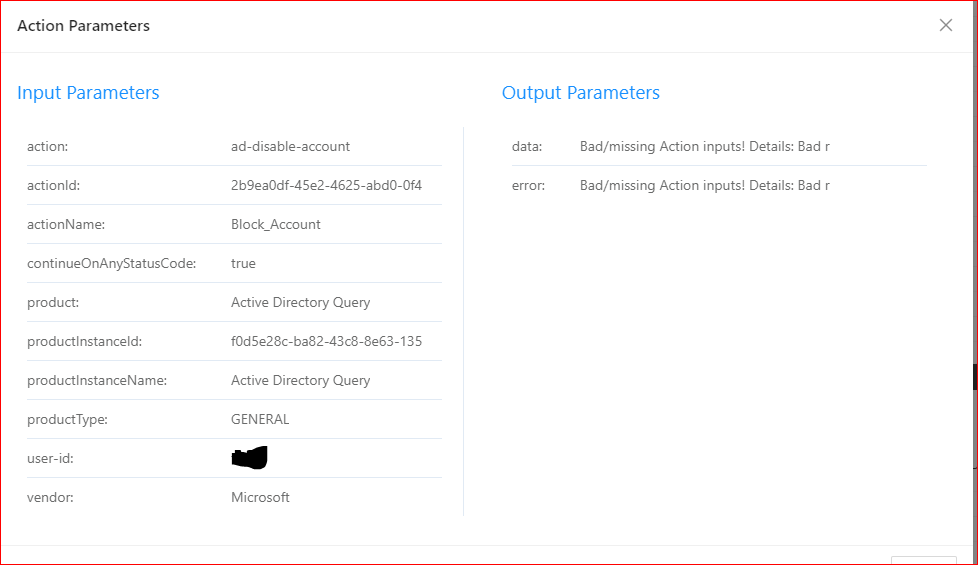
I am trying to create a playbook in order to block an account. However I have an error message thas I can’t undrestand the reason.
Could you please tell me why I have this error message ?
“Bad/missing Action inputs! Details: Bad rest-action url: /users/...”
Thank you in advance.
Regads,
Siawash
-
Data privacy on dashboards
I have activated the “Data Privacy” module and configured the fields, concerned groups, etc.
I have a dashboard whose query contains one of the “encrypted” fields defined into “data privacy” module. Since activation, the dashboard is not displaying information anymore.
There is a way to allow (via request/grant or something else) the dashboard to display the information ?
Thanks,
Alexandru -
SOAR Playbook Creation From LogPoint Alerts
Hi,
I need your help regarding the SOAR. In fact, I have just started the SOAR and I want to create a playbook From LogPoint alerts in order to block an IP@ or an action. Could please help me ? How can I do that ?
Thank you in advance.
Regards,
Siawash
User groups in Zendesk Community allow members to connect, share insights, ask questions, and collaborate within specific interest areas.