Welcome to Logpoint Community
Connect, share insights, ask questions, and discuss all things about Logpoint products with fellow users.
-
Roundtable discussion with LogPoint VP of Customer Success
Join us on the next Customer Success Roundtable session on October 21 3PM-4PM CET and share your ideas and feedback directly with the VP of Customer Success on how to improve LogPoint products and services.
To register, simply send an email to customersuccess@logpoint.com
-
Send your feature requests directly to the LogPoint Product Team going forward! 🥳😎
We are now launching the LogPoint Ideas portal and would like you to join. Simply click the link below and log in with your existing support credentials, easy as that you are now ready to submit and upvote feature requests. Alternatively, you can always access the Idea Portal from the Community, just go to: homepage→ upper right corner→click Idea Portal
Join here: https://logpoint.ideas.aha.io/
-
Join: Restricting "followed by" using time conditions
Hello,
i am facing following scenario:
I want to monitor web gui access to a device, especially the host a access was attempted from. However, most of the access attempts are done from different LANs, using web proxies. Hence, i only see the ip of the web proxies as the source ip of the login attempts.
I therefore like to use some kind of join to retrieve access attempts to the device, and then check the web proxies which ip was accessing the device IP at around that time (e.g. within two seconds). (I tried a join based on the exact same time, but this approach leaves out many events).So basically, i need something like
[search1] as s1 followed by [search2] as s2 on s1.log_ts <= s2.log_ts + 2 seconds
Does any body know how i can accomplish this, or knows of a different approach ?
Andre
-
Why this query is wrong?
Hi,
when I start a query
| chart min(log_ts) as min_ts by min_ts, source_address, destination_address
I receive the error message:
could not convert string to float: '/'.
But why?
An example for log_ts: 2021/10/11 11:04:54
I use
| chart count() as "Count", min(log_ts) as min_ts, max(log_ts) as max_ts
in a macro and I am sure that in fewer versions of Logpoint I didn’t receive this error message.
Actually I use Logpoint version 6.12.0
Best regards,
Hans Vedder
-
Creating Alert Rules PAK File
HI,
i want to integrate many of the SIGMA Rules found here:
https://github.com/SigmaHQ/sigma
I was able to translate them into the Logpoint Query Language and Now i want to Import them as Alert Rules.
Doing each one by one manually in the GUI is a very time consuming/impossible Task.
Is there a Way to Import Alert Rules beside the .PAK Files? Or is there a Defintion how such a .PAK File looks?
Best Regards
Timo
-
Live session introducing LogPoint SOAR
Hi All,
Just wanted to remind you of the awesome opportunity to join our live session with Doron Davidson, LogPoint VP Global Services, who will introduce LogPoint’s new capabilities to automate incident detection and response.
Join the session to:
- Learn how automatic response playbooks reduce the mean time to respond
- See a product demo of common use cases
- Understand the value of truly native response capabilities in LogPoint SIEM
Joining links:
Oct 5 for Partners: https://logpoint.zoom.us/webinar/register/WN_lSn4uIOsSPqlMrv03T4c1Q
Oct 7 for Customers: https://logpoint.zoom.us/webinar/register/WN_LwrLoaX5SgKLRF-A4l1Nsw
Oct 12 for Visitors: https://logpoint.zoom.us/webinar/register/WN_3Lf-tA0yTHKOa5cCyM1ATg
-
LogPoint 6.12 - Speed up incident response with more contextual awareness
Join Sales Engineer @Nils Krumey on October 5 on a live session where he will demo how the new update to LogPoint can help security analysts react to and resolve threats quickly by knowing instantly which type of threat it is.
Join the knowledge session to:
- Learn how the new categorisation of alerts and incidents to the MITRE framework can speed up incident response
- See how you now can share search and report templates
- Understand how LogPoint is making it easy to route incidents to different SOAR playbooks based on the incident type
Register on the link below:
https://lnkd.in/ggg9pvMH -
Adding devices to logpoint with CSV
Hi
I have 70+ devices to add to logpoint for monitoring. The version of Logpoint is 6.7.4.
I dont want to key them in with the GUI (takes too long, risks of mistakes). I have the device details in a spreadsheet - extracting to a csv and loading the csv into logpoint with the UI is the best way.
The device uses a proxy
I have followed the documentation - but perhaps I’ve misread something.
The CSV line below gives the error “Exception, Nonetype object has no attribute split”
device_name,device_ips,device_groups,log_collection_policies, distributed_collector,confidentiality,integrity,availability,timezone,uses_proxy, proxy_ip, hostname, processpolicy
device1,10.0.0.1,linux,,,,,,Europe/London,TRUE,192.168.1.1,10.0.0.1,LinuxI can add devices without issue if I remove the last 4 fields from the csv (i.e. uses_proxy, proxy_ip, hostname, processpolicy), but i do want to add the syslog collector details.
Does anyone know if the add devices with a csv actually works when you want to also add the syslog collector ?
Thanks
Patrick Kelly
Note: my question doesnt fit into any of the predefined categories, I have to put it into Operations Monitoring.
-
LP Director automation and Ansible
Hi,
Today I had a discussion with a customer regarding LP Director and ansible.
The customers question was – are any Ansible Module available. Does LogPoint provide any modules / scripts for Ansible to allow a faster integration of Ansible to Logpoint Director automation?
Best Regards,
Johann -
Extract of LPA information for customer use
When using the LogPoint agent all administration is done in the LPA plugin, which can only be accessed by the LogPoint administrator.
Some customers wants reporting on the operational side of things and part of that is a report displaying:
Device Name ,Template,Source,Encryption,Last Config Update,Status
How can this output be created without supplying the customer with a number of screen shots
-
Can LogPoint SOAR integrate with other SOAR platforms, such as Palo Alto XSOAR, Swimlane, etc?
LogPoint SOAR will become a native part of LogPoint 7, releasing Q4 2021. LogPoint continues to believe in the value of partnering with third-party solutions, including SOAR providers, to extend the value of LogPoint. We will continue investing in and expand our integrations with market-leading providers.
-
LogPoint introduces native SOAR into core SIEM offering, advancing cybersecurity automation and efficiency
We are excited to announce the successful completion of our acquisition of Tel Aviv-based SecBI . SecBI’s universal SOAR and XDR technology will integrate natively with LogPoint to form an integrated, foundational Security Operations platform. SOAR will be released with LogPoint 7.0 in December 2021, and XDR will be introduced in Q2 2022.
Until then, check out the SOAR product brochure attached herewith and join our webinar on October 12 to:
- Learn how automatic response playbooks reduce the mean time to respond
- See a product demo of common use cases
- Understand the value of truly native response capabilities in LogPoint SIEM
-
Alarm a missing Event...
Hi @all,
do anyone have an Idea how to alarm a missing Event like:
Every Morning around 4 there should be a “successful copy” Event. I want to Alarm if exactly this Event is missing.
The Alarm should fire around 6 and not much later.
My only Idea is to run a scheduled Report because i can’t configure the ALarm to rum exactly in the Timeframe of 2 hours.
Am i wrong?
-
Roundtable with LogPoint's Product Manager for UEBA
Hello everyone,
I just wanted to direct your attention to a roundtable that we have coming up with Jon Eglisson, our Engineering Manager for UEBA in the CTO office.
So if there’s anything you always wanted to know about LogPoint’s UEBA solution this should be an interesting one to attend!
You can find the signup link here:
-
Normalizer Timestamp
I have a nice Logfile (FlatFile with once a day import via Ubuntu LogPoint Agent) containing a timestamp like:
| 20210905 | 231304 |
Any suggestions how i need to modify my Normalizer to understand this Time ?
Edit:
I do some sed Magic and change the Format directly in the Logfile
-
How to detect stealthy Cobalt Strike activity in your enterprise
Cobalt Strike , first released in 2012, is a commercial adversary simulation tool and is popular among red teams, pen-testers, and threat actors alike. In essence, Cobalt Strike is a modularized post-exploitation framework that uses covert channels to simulate a threat actor in the organization’s network.
Cobalt Strike’s popularity is mainly due to its beacons being stealthy, stable, and highly customizable. The beacons are stealthy due to in-memory execution via reflection into the memory of a process without affecting the file system. Cobalt Strike’s post-exploitation suite includes support for keylogging, command execution, credential dumping, file transfer, port scanning, and more, making the adversary’s job easier. Malleable C2 is another beloved feature of Cobalt Strike that allows attackers to change how its beacons look and mimic other legitimate traffic to stay under the radar.
Though the vendor screens the distribution of licenses to security professionals, adversaries were able to crack and leak it frequently. In fact, two months before, Proofpoint had reported that adversarial use of Cobalt Strike increased 161 percent from 2019 to 2020 and still remains a high-volume threat in 2021. Proofpoint disclosed that they had attributed two-thirds of identified Cobalt Strike campaigns from 2016 through 2018 to well-resourced cybercrime organizations or APT groups. APT29 , APT32 , APT41 , Cobalt , FIN6 , T A505 , TIN WOODLAWN and Mustang Panda are just some of the threat actors who have used Cobalt Strike for their operations.
Cobalt Strike was repeatedly used in the high-profile SolarWinds supply chain incident where the Raindrop loader dropped the Cobalt Strike payload. Several ransomware strains like Ryuk, Conti, Egregor and DoppelPaymer have started to use Cobalt Strike to speed up their ransomware deployment. In September 2020, Cisco Talos reported that 66 percent of ransomware attacks involved Cobalt Strike and ransomware actors heavily rely on the tool as they abandon commodity trojans.
Cobalt Strike’s post-exploitation features are exposed via beacons that are executed in the memory of the infected system. Security analysts can create detections from the beacon’s leftover artifacts while performing post-exploitation. Similarly, analysts can use default settings like beacon names and default certificates to help aid detection.
LogPoint has now released UseCases v5.0.4 , which includes alerts and a dashboard for Cobalt Strike to help you identify threats within your environment, so you can take corrective actions against them.
Detecting Cobalt Strike activity in LogPoint
Named pipes are essential for the operation of Cobalt Strike beacons. Before version 4.2, Cobalt Strike did not allow the operators to change the default naming scheme of named pipes. If Sysmon is deployed in the environment and correctly configured, then it is an opportunity to detect Cobalt Strike’s default named pipes.
  norm_id=WindowsSysmon label=Pipe


  pipe IN ["\msagent_*", "\MSSE-*-server", "\postex_*", "\status_*", "\mypipe-f*", "\mypipe-h*",


  "\ntsvcs_*", "\scerpc_*", "\mojo.5688.8052.183894939787088877*", "\mojo.5688.8052.35780273329370473*"]
Sysmon rules for Cobalt Strike Pipe Names
LogPoint customers can refer to our base sysmon configuration that covers various Cobalt Strike activities.
Adversaries commonly use Cobalt Strike’s named pipe impersonation feature to obtain SYSTEM privileges that can be detected via process creation events.
  norm_id=WinServer label="Process" label=Create


  parent_process="*\services.exe"


  command IN ['*cmd* /c *echo *\pipe\*', '*%COMPSEC%* /c * echo *\pipe\*', '*rundll32*.dll,a*/p:*']
Search for Cobalt Strike Named Pipe Impersonation
You can also hunt for artifacts in services created by Cobalt Strike from the Service Control Manager (SCM) logs.
norm_id=WinServer event_id=7045 ((path="*ADMIN$*" service="*.exe") OR (path="%COMSPEC% /b /c start /b /min powershell -nop -w hidden -encodedcommand*"))The creation of the Sysmon remote thread logs aids in detecting Cobalt Strike’s process injection activity.
norm_id=WindowsSysmon event_id=8 start_address IN ["*0B80", "*0C7C", "*0C88"]Cobalt Strike spawns rundll32 without any command-line and regularly injects the necessary payload code into rundll32’s memory. Therefore, you must check for the creation of rundll32 without any command-line arguments unaffected by the noise.
  label="Process" label=Create


  "process"="*\rundll32.exe" command="*\rundll32.exe"
Next, you can decode PowerShell sessions with the default command-line prefix and watch for snippets of commands commonly used by Cobalt Strike.
  norm_id=WinServer event_source=PowerShell event_id=400


  application="powershell -nop -exec bypass -EncodedCommand*"


  | norm on application -<:'EncodedCommand\s'>


  | process codec(decode, encoded_command) as decoded_command


  | search decoded_command IN ["*IEX*DownloadString*127.0.0.1:*",


  "Invoke-WMIMethod win32_process*-argumentlist*", "Invoke-Command -ComputerName*-ScriptBlock*", "*=New-Object IO.MemoryStream [Convert]::FromBase64String*"] | chart count() by host, device_ip, decoded_command, encoded_command
Cobalt Strike’s powerpick command enables the execution of unmanaged PowerShell. You can hunt for the activity via mismatch in the host version and engine version in PowerShell’s Engine Lifecycle events.
  norm_id=WinServer event_source=PowerShell event_id=400


  hostname=ConsoleHost application="*\rundll32.exe"


  | process compare(host_version, engine_version) as match


  | search match=False
Search for mismatch in host version and engine version in PowerShell’s Engine Lifecycle events
Proxy execution via RunDLL32 and Regsvr32 remains the most popular method for executing Cobalt Strike beacons. You can hunt for executions of the binaries from suspicious locations.
label="Process" label=Create "process" IN ["*\rundll32.exe", "*\regsvr32.exe"] command IN ["*C:\ProgramData\*", "*C:\Users\Public\*", "*C:\PerfLogs\*", "*\AppData\Local\Temp\*", "*\AppData\Roaming\Temp\*"]
Search for loading of DLLs from suspicious paths
You can hunt for default certificates that appear with Cobalt Strike when adversaries forget or ignore to change the default certificates.
(certificate_serial="8BB00EE" OR certificate_serial_number="8BB00EE")
Search for default Cobalt Strike certificate
Finally, watch for IDS/IPS alerts related to Cobalt Strike. Cisco Talos provided a list of snort rules that can help you detect the Cobalt Strike infection.
norm_id IN [Snort, SuricataIDS] (message IN ["*CobaltStrike*", "*Cobalt Strike*"] OR signature IN ["*CobaltStrike*", "*Cobalt Strike*"])Expect the use of Cobalt Strike to rise
Many threat actors use default settings in Cobalt Strike, making detections easier for defenders. On the other hand, sophisticated threat actors who care about OPSEC, change the defaults to evade detection. Enterprises can purchase threat intel feeds, such as DFIR Reports , to obtain a list of IP addresses of Cobalt Strike servers used as IoCs to sweep their network.
In the coming years, you can expect threat actors to continue and even increase their use of Cobalt Strike to help target all industries due to the stability, versatility, and difficult attribution of Cobalt Strike.
-
Masterclass - 14. september 2021 MITRE ATT&CK by Jan Quach – hvordan kan du få gavn af det i din organisation
Ønsker du et bedre overblik over din infrastruktur og hvad der foregår, så er det en god idé at bruge MITRE ATT&CK frameworket, som er gratis. Vi vil tale som forudsætninger, og om hvordan du får det fulde udbytte af dashboardet, alarmer med videre.
- Introduktion til MITRE ATT&CK
- Forudsætninger for at kunne bruge MITRE ATT&CK i LogPoint
- Dybere indblik i alarmer, dashboards og visualisering
-
Case Management
Hi, i am just wondering if there was any plans to include any form of case management with the product.
We are currently commenting on incidents an a structure way to allow us to search back through them, but having the ability to save multiple logs which relate to an investigation for the purposes of escalation or handover or to even store outside of the various repos to have a log retention period would be so useful. I know that this is possible currently through exporting the logs out, but these take the raw logs out of logpoint which is not as useful.
Without wanting to point to another vendor, LogRhythm have similar case management functionality which allows you to add certain logs into a case/investigation for ease.
-
Fetching logs using Nessus Fetcher
Installed Nessus. Configured Nessus fetcher in LogPoint and communicated with Nessus successfully. What is the following procedure that the Nessus logs are imported to LogPoint?
Thanks in advance.
-
Training Calendar Q4 2021-Q1 2022
At LogPoint, we’re committed to offering top-notch training sessions and workshops for our customers and partners. We strongly believe that enablement and continuous education are the cornerstones of effective day-to-day work and positive user experience. With our diverse course portfolio, we provide training options – at all levels – for security professionals, partners and MSSPs.
We currently offer the following training courses:
- Certified LogPoint Administrator
- Certified LogPoint User
- Certified LogPoint Director
- Advanced Training
COURSE TYPE
DATE TIME LANGUAGE CERTIFIED LOGPOINT ADMIN 11-12 APRIL 2022 9AM-4PM CET ENGLISH CERTIFIED LOGPOINT USER 13-14 APRIL 2022 9AM-4PM CET ENGLISH CERTIFIED LOGPOINT ADMIN 9-10 MAY 2022 9AM-2PM CET ENGLISH CERTIFIED LOGPOINT USER 11-12 MAY 2022 9AM-4PM CET ENGLISH CERTIFIED LOGPOINT ADMIN 6-7 JUN 2022 9AM-4PM CET ENGLISH CERTIFIED LOGPOINT USER 8-9 JUN 2022 9AM-4PM CET ENGLISH CERTIFIED LOGPOINT USER 8-9 DECEMBER 2021 9AM-4PM CET ENGLISH CERTIFIED LOGPOINT ADMIN 11-12 JULY 2022 9AM-2PM CET ENGLISH CERTIFIED LOGPOINT USER 13-14 JULY 2022 9AM-4PM CET ENGLISH CERTIFIED LOGPOINT ADMIN 8-9 AUG 2022 9AM-4PM CET ENGLISH CERTIFIED LOGPOINT USER 10-11 AUG 2022 9AM-4PM CET ENGLISH IMPORTANT:
All courses displayed here are in English and, for the time being, are held online due to Covid19 restrictions.
The course schedule will be continuously updated.
For inquiry about registration and pricing, contact your local LogPoint Account Representative.
This schedule does not contain regional training courses held in local languages, to inquire about regional courses, contact your local LogPoint Account Manager. To read more about the scope and curriculum, please see the brochure attached to this article

-
Has anyone been able to integrate TheHive for managing cases ?
I am trying to create a use case where i can connect TheHive with LP. Lets discuss if anyone has been able to or planning to do this
-
Customer Success Roundtable discussion with LogPoint's VP of Customer Success
Join us on the next Customer Success Roundtable session on August 24 3PM CET and share your ideas and feedback directly with the VP of Customer Success on how to improve LogPoint products and services.
To register, simply send an email to customersuccess@logpoint.com
-
Multi line parser for Java applications.
Hi.
We are trying to push multi-line logs to Logpoint, for example a stack trace.
They are created by Java applications like Jboss, Tomcat and few more. Where we have some debug information in logs such as content of XML messages processes by the system etc.
When such logs are displayed in Logpoint, we need to preserve the line breaks along with indentation to make them readable by a human.
Can you please show a complete recipe on how to achieve that?
I saw this topic
https://community.logpoint.com/normalization-parsing-43/multi-line-parser-147
and understood that there are some pre-compiled normalizers which can be used, can you please explain how they gonna work and how exactly we need to:
1. send logs to Logpoint
2. process logs in logpointIn order to be able to present properly formatted (line breaks and indentation) logs for users who will look for the logs ?
Thanks
-
New Blogpost - Detecting PetitPotam
Remember to read the latest Blogpost
Watch out for PetitPotam, a relay attack that can compromise your domain without any authentication. In this blog post, our Security Analytics Engineer Babesh Rai takes you through all you need to know to mitigate the threat and detect the attack chain in LogPoint
Read the post here: https://www.logpoint.com/en/blog/detecting-petitpotam-a-relay-attack-that-can-compromise-your-domain-without-any-authentication/
/ Brian
-
Problem adding McAfee ePo server via Syslog
We configured our McAfee ePO (5.10) server to send its logs to a syslog server and configured it in the LP accordingly. Yet, when using the “Test Syslog” Feature in McAfee ePO, the test failed. Nonetheless, we are receiving logs from the server, but they only contain gibberish.

LP raw logs This is as far as i think not a problem with normalization, as a tcpdump also shows the log payload not being human readable.
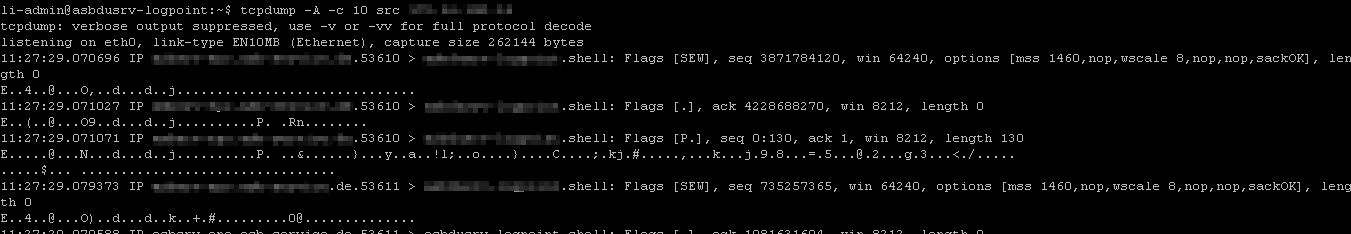
tcpdump I already tried to change the charset min the log m,collection policy from utf_8 to iso8559_15 and ascii, to no avail.
I found following McAfee ( KB87927 ) document, which says:
ePO syslog forwarding only supports the TCP protocol, and requires Transport Layer Security (TLS) . Specifically, it supports receivers following RFC 5424 and RFC 5425 , which is known as syslog-ng . You do not need to import the certificate used by the syslog receiver into ePO. As long as the certificate is valid, ePO accepts it. Self-signed certificates are supported and are commonly used for this purpose.
So my current guess it that the test connection failed as the ePO is expecting the LP to encrypt the traffic, which it does not do. Yet it still started to send the LP encrypted logs (but what cert does he use), therefore the gibberish.
Hence my question, did anyone manage to successfully retrieve usable logs from a McAfee ePO server using Syslog, or might have any suggestion what is wrong with my configuration ?
-
Is it possible to create a device group with devices on a remote LP ?
Hello,
as the title says i was wondering whether devices that are configured as a log source on a remote LP can be added to a devices group configured on the local LP?
Our network is divided into two locations connected via a MPLS connection, and to prevent devices sending their logs over the MPLS line we configured a LP at each location and added one LP as a remote LP into the other LP (our “main LP”).
I would like to create an alert on our “main LP” to notify us when a deviceis no longer sending logs. Hence i would like to create a device group on the “main LP” containing all the devices the alert should “monitor”, but i am unable to add devices that are configured as log sources on the remote LP. As far as i understand the documentation, it is possible when using LP Director (which we do not have), but not possible in our scenario. Just would like to confirm this and that i have to create an altert on both LP monitoring the “local” log sources.
-
VulnerabilityManagement_5.1.0 Hack - Rapid7 - InsightVM Site Scans
→ I’m not responsible if anyone Brick the System! ←
For everyone who is using Rapid7 InsightVM:We upgraded the provided LogPoint Script with the ability to import SITE Scans instead of normal Scan Reports.
The Reason is that SITE Scans are scheduled on the IVM so the complete Vulnerability Scan and Import into LogPoint is without any manual interaction - there is no need to run the Report manually.
What to do on LogPoint: Just replace the script attached here with the Script installed on your DataNode and configure the Rapid7 integration.
What to do on Rapid7 Machine:1. Create user with following permissions:
- Appear on Ticket and Report Lists: Appear on user lists in order to be assigned remediation tickets and view reports.
- View Site Asset Data: View discovered information about all assets in accessible sites, including IP addresses, installed software, and vulnerabilities.
- Create Reports: Create and own reports for accessible assets. Configure all attributes of owned reports, except for user access.
- Use Restricted Report Sections: Create report templates with restricted sections. Configure reports to use templates with restricted sections.
- Manage Report Access: Grant and remove user access to owned reports.
2. Create Report for Sites/AssetGroup/Assets/Tags/Scan- Set Name: LogPoint_XML_Site_Report
- Set ReportTemplate: XML Export 2.0
- Select Scope: Site_ABC
- (Optional) Use only assets found in the last scan
- Frequency: Run a recurring report after every scan
- Save & Run the Report
-
Customer Success Roundtable and LogPoint Cyber Professionals Panel – sign up for the newsletter today for the registration details!
We will soon be sending out our new Customer Success Newsletter, if you are not already receiving newsletters from LogPoint, sign up here: https://go.logpoint.com/customernewsletter-signup
This issue will contain information about our new Customer Success Roundtable sessions , LogPoint`s Cyber Professionals Panel as well as Fighting the Ransomware war , Machine Learning, UEBA, Sizing Calculator and new integrations.
Regards,
Brian Hansen
VP, Customer Success
-
device export script
Hi
Today I have a Python script for exporting devices in to a csv-file with the following fields:
device_name,device_ips,device_groups,log_collection_policies,distributed_collector,confidentiality,integrity,availability,timezone
Does a script exist that also extract the additional fiels:
uses_proxy , proxy_ip , hostname
This will make moving devices from LogPoint 5 to LogPoint 6 considerably more easy.
Regards
Hans
-
LogPoint Certification Exams
I have just done my Certified LogPoint Administration course and received an invite to take the exam.
The website doesn’t indicate how long I should allow to take the exam!
Is there anyone out there that knows how much time I should allow? 30 mins, 1 hour, 3 hours!
I just don’t want to press the start button and find I have just committed to a 3 hour exam (eek).


User groups in Zendesk Community allow members to connect, share insights, ask questions, and collaborate within specific interest areas.