Welcome to Logpoint Community
Connect, share insights, ask questions, and discuss all things about Logpoint products with fellow users.
-
PaloAlto PanOS 10 - Logs not normalized
Hello,
since we replaced the PaloAlto firewall devices a couple of days ago (the old ones were running PanOS 9.1.7, the new ones are on 10.1.4) for one of our customers, none of the logs coming from the firewalls are normalized anymore (there are 1000s of logs in the repo, but doing a search query “ norm_id="*" “ shows no result).
We are using the same policies (collection, normalization etc) as before, and the firewall admin says that they just migrated the configuration fromt ht eold to the new devices and can not see any changes regarding the log configuration settings.
I already restarted all normalizer services, even rebooted the LP and completely recreated the device configuration.
We are using the latest (5.2.0) PaloAlto Application plugin on LogPoint 6.12.2, and its details clearly state that PanPOS 10 is supported ( Palo Alto Network Firewall – ServiceDesk # LogPoint ). And taking a look at the raw logs, i can not see any differenc in the log format of PanOS 9 and 10. However, also tried adding the “PaloAltoCEFCompiledNormalizer” to the normalization policy (it “only” included the PaloAltoNetworkFirewallCompiledNormalizer), but nothing helped.
Does anyone has any thought what might be the issue or what else i can check before i open a support ticket. Is there any way to debug the normalization preocess on the LogPoint CLI ?
Regards
Andre
-
Spots available for free of charge Troubleshooting training today :)
Hi All,
We have some limited spots available for Today`s Troubleshooting Advanced Training
FREE OF CHARGE for a limited time. Don´t miss this opportunity to learn about the inner workings of LogPoint.
Course starts at 2PM CET today and ends at 4PM
Sign up here: https://logpoint.zoom.us/webinar/register/WN_tuBoQmAfTd6MinWokEyCUw?_ga=2.81719319.1236759532.1643011193-1106456273.1632296641
-
Fetshing Logs from Oracle DB on Redhat
Hello everyone,
I want to collect oracle DB logs in redhat with SCP fetsher. does anyone know the exact locations of the logs.
NB: I have already tried with the logs of redo*.logs, but they are not readable.
Regards
-
Expect prolonged response time from Support due to faults in internet submarine cable supply in the Indian Ocean.
Dear All,
We have been informed that there’s a problem with the under-sea cables between India and Europe resulting in connectivity issues. While work is underway to fully restore internet services at the earliest we are asking for your patience while we are doing our utmost best to ensure that your tickets are all resolved as fast as possible.
In the meantime, we encourage you to use this community for instant help on non-critical issues.
-
LogPoint 7.0 is available now!
We are excited to announce that today we have released LogPoint 7.0.
With LogPoint 7, SOAR is a native part of the SIEM, which means getting one out-of-the-box tool for the entire detection, investigation and response process.
To learn more about LogPoint 7.0, access product documentation here: https://docs.logpoint.com/docs/install-and-upgrade-guide/en/latest/ or read our official press release here: https://www.logpoint.com/en/product-releases/streamline-security-operations-with-logpoint-7/
Should you have any specific 7.0 questions, post it in the Community and we will do our best to address it asap :)
-
Does the Open Door use the Syslog Collector TLS Certificate?
Wir haben einen Kunden, der das neue Feature zum Hochladen der SSL/TLS Zertifikate für den Syslog Collector über die Web Oberfläche genutzt hat.
Does this have any effect on the certificates used by OpenVPN?
Because currently, after configuring the Distributed LogPoint, we see in the OpenVPN client log (
/opt/immune/var/log/service/remote_con_client_xx.xx.xx.xx/current) that the certificate cannot be verified:2022-01-04_11:12:48.10967 Tue Jan 4 11:12:48 2022 VERIFY ERROR: depth=0, error=unable to get local issuer certificate: XXX -
[HOW TO] MPS per repo and per log source
Hello all,
I would like to visualize:
 MPS sent by each log sources
 MPS per repo_name
I have managed to create a timechart of MPS per repo_name:
repo_name=* | timechart count() by repo_name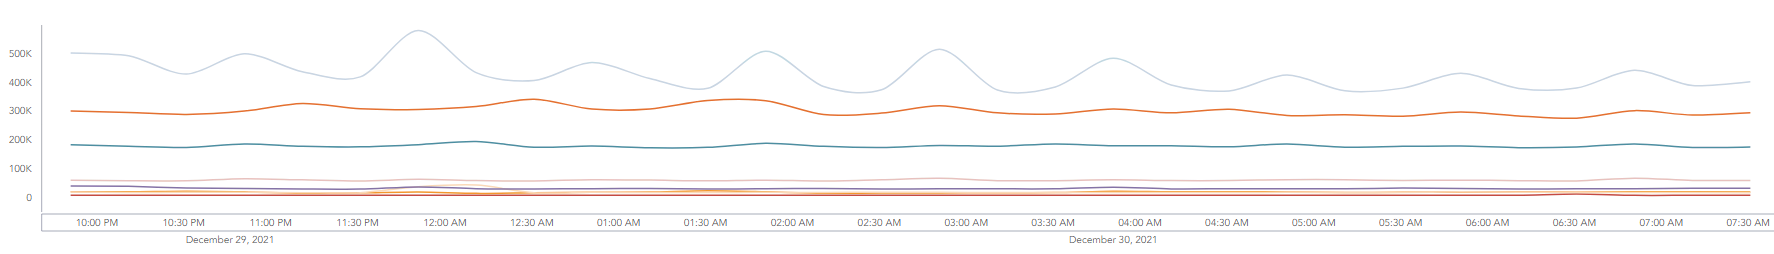
Note : This is not really MPS per repos, but log volume per repo.
But I cannot find how to generate the equivalent for each log sources.
Thanks for your help!
-
Detecting Log4Shell requires more than just a SIEM
I addition to the blog-post about LogPoint and Log4j update here: https://www.logpoint.com/en/blog/status-on-log4j-vulnerability-in-logpoint/ - LogPoint also created another Blog-Post on how a combination of tools and a defense-in-depth mindset will give organizations the ability to detect post-compromise activity and put a stop to the attack
Read it here: https://www.logpoint.com/en/blog/detecting-log4shell-requires-more-than-just-a-siem/
Regards,
Brian Hansen, LogPoint
VP, Customer Success
-
Update on Log4j
Dear LogPoint Partner and Customer.
Recently, a critical remote code execution vulnerability in Apache log4j ( CVE-2021-44228 ), was discovered, affecting versions 2.0-2.14.1.
Vulnerability status of LogPoint products
At this time, we have determined that no LogPoint products are affected by the vulnerability.
For detailed information about the vulnerability status of each LogPoint product, please consult the table below. If you have any questions about the vulnerability, please contact LogPoint Support or LogPoint Community.
Details of vulnerability by LogPoint product
Product
Vulnerable?
Reason
LogPoint 6.12.2
Not affected
Log4J v 1.2 used
Previous LogPoint versions
Not affected
Previous versions used
UEBA
Not affected
Log4J v 1.x used
LogPoint Agent
Not applicable
Not used
Director Console
Not affected
Log4J v 1.2 used
Director Fabric
Not affected
Log4J v 1.2 used
Search Master
Not affected
Log4J v 1.2 used
AAHC
Not affected
Log4J v 1.2 used
Plugins
Not affected
Log4j v 1.2 used
Applications
Not applicable
Not used
LogPoint for SAP HANA
Not applicable
Not used
LogPoint for SAP Light
Not affected
Not used
LogPoint for SAP Extended
Not applicable
Not used
* Note: log4j v1.2.x is vulnerable to another vulnerability, that is only exploitable when using the class JMSAppender. While LogPoint uses log4j in version 1.2, JMSAppender is not used in LogPoint and we have actively attempted to exploit the vulnerability, confirming that in these cases log4j v1.2 is not vulnerable in the current deployment configuration.
http://cve.mitre.org/cgi-bin/cvename.cgi?name=2021-44228
Regards,
Brian Hansen, LogPoint
VP, Customer Success
-
Is LogPoint vulnerable to CVE-2021-44228
Hello LogPoint Support / LogPoint Community,
regarding the news about the log4j 2 CVE-2021-44228, I’ve been wondering whether log4j Version 2 is in use in the LogPoint Core SIEM or other parts of your product suite.
Could you please evaluate this and inform us partners and customers about the probable impact of this CVE?
Thanks so much in advance,
Tobias Weidemann
-
Documentation- Integration
HI Team.
We are checking for Integration documentation with LogPoint for the below products:
1.Okta
2.Saleforce
Do we have usecase package inbuilt ?
-
Logpoint Incidents Integrate with ServiceNow
Hi Team,
Is it possible to integrate Logpoint -Incident page to ServiceNow.
We want to check whether Logpoint has that capability.
Thanks
Satya
-
Notification - Device not sending logs >24 hours
Hi Team,
How to setup “Device not sending logs “ alert in Logpoint and how to configure that alert to email like sftp setup.
Thanks
Satya
-
Tagging devices - criticality
Hi Team,
Can we tag the device criticality in logpoint,
We are looking to create notification for critical and high severity devices.
-
Which firewall ports should be opened for logpoint server?
Hi,
on my firewall I opened port 443 to destination customer.logpoint.com (172.67.190.81 and 104.21.76.59).
Now I see on the firewall that the server tries to open connections to the ip addresses 104.16.37.47 and 104.16.38.47 through port 443. Are these connections also needed?
Best regards,
Hans Vedder
-
Getting false alerts for inactive devices
Hello,
to get noticed when a device is no longer sending logs i created an alert that uses this search query:
device_ip in DG_AKTIVE_GERAETE | chart count() by device_name,device_ip | search 'count()' = 0
(AKTIVE_GERAETE is a device group i put all the devices in that should be monitored).
The alert runs every two hours and nearly every day at the same time (1am) i get an alarm per email that one of our firewalls didn’t send logs. I am pretty sure that is a false positive .
However, when clicking of the link in the email, i indeed see a hit.
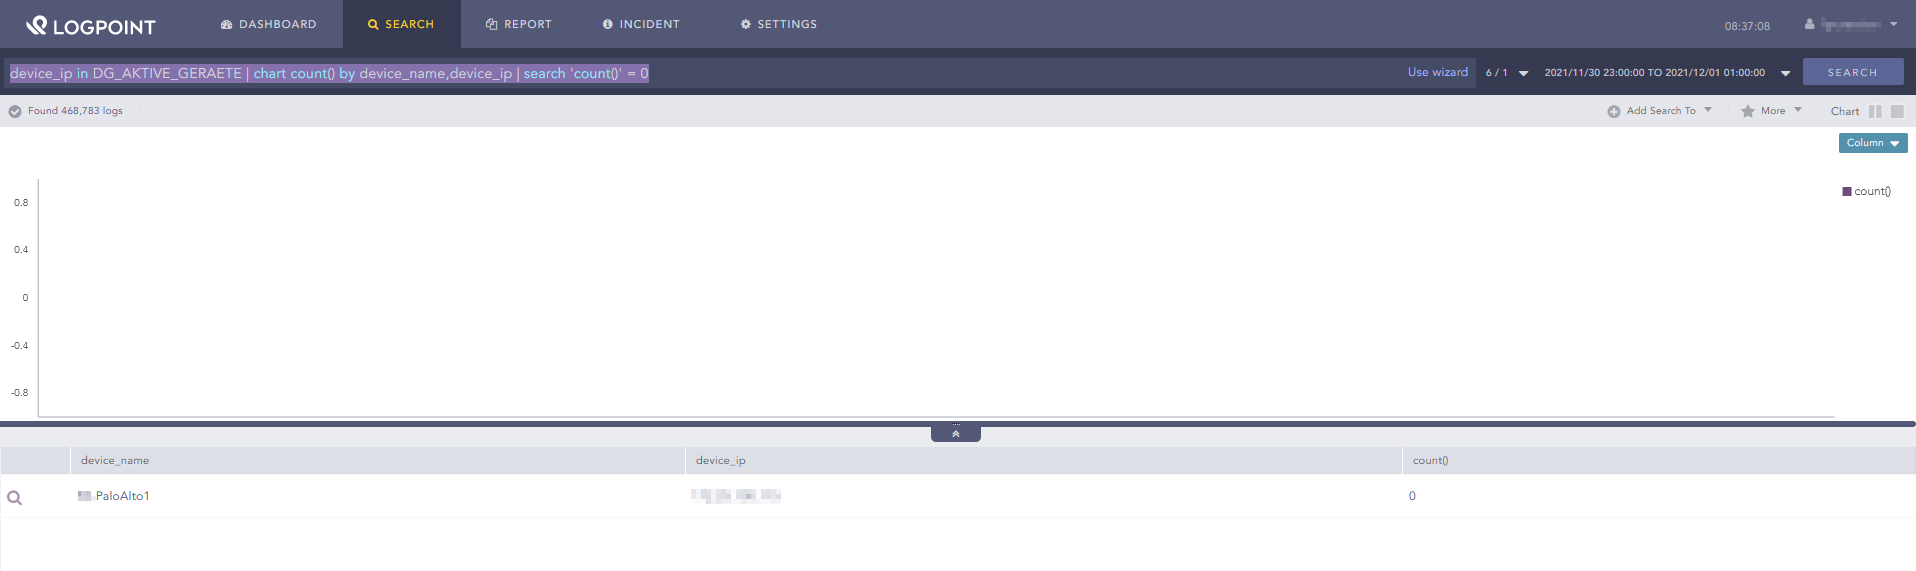
False alert But when searching again by clicking on search, there isn’t a hit anymore.
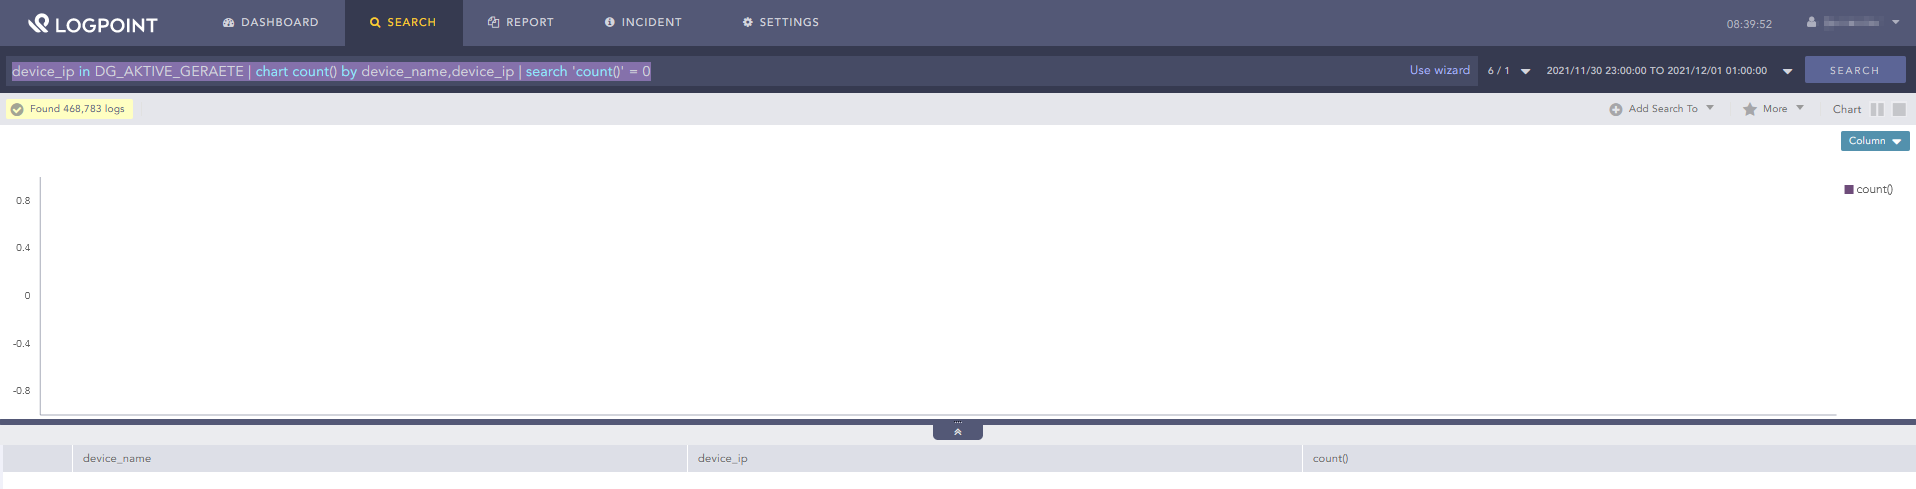
Displaying all logs from this device for the last 24 hours also does not show any missing logs for this time
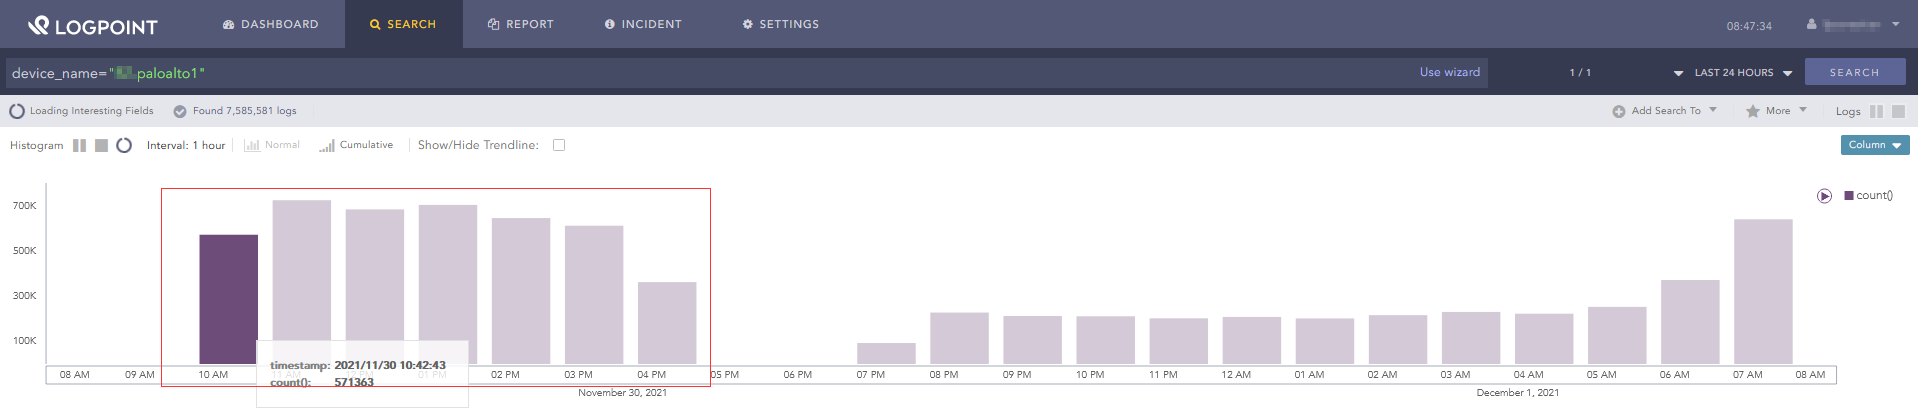
So, as i said, pretty sure it is a false positive.
The alert is always triggered for the same device and always for the same timeframe (23pm and 1am) , so i was thinking that the LP wants me to somehow acknowledge it before stopping to trigger it. But i already marked and closed all incidents of the alarm at one point, but the next day the alarm was triggered again.
Here is the configuration of the alert:
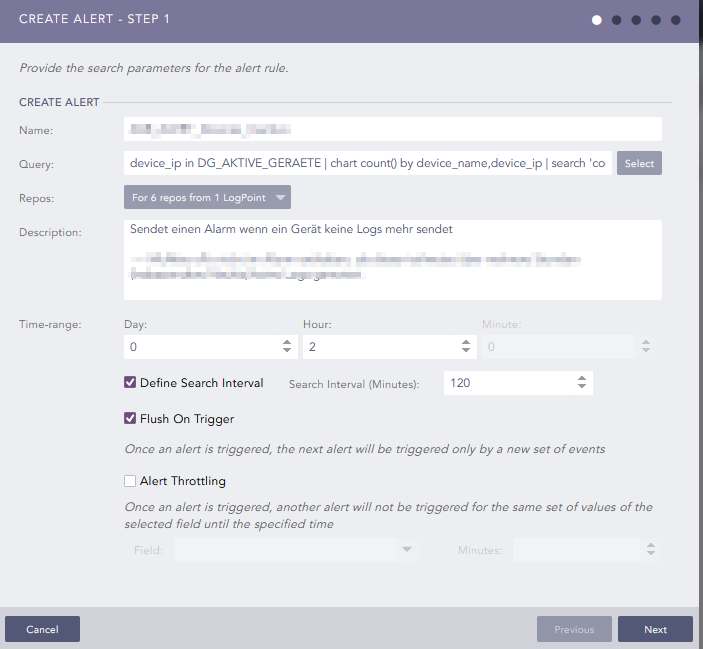
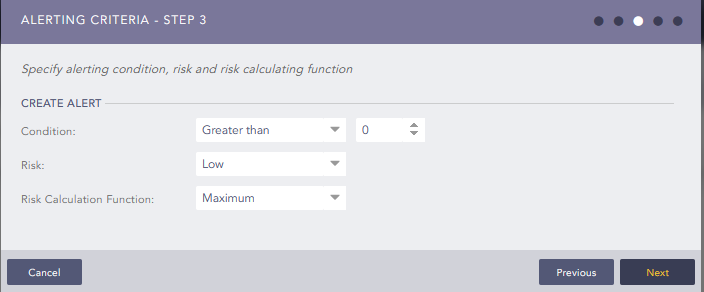
Anybody got any ideas ? Am i missing something ? I know the next LP version will have the detection of inactive device “build in”, but i am curious what is going on here.
Andre
-
The use of certificates in LogPoint
Hi
I need a description of the usage of cerificates in LogPoint
What are the recomandations?
Which certificate are stored where?
Which cautions should be taken when replacing certificates?
the location of each respective certificate
- HTTPS
- Syslog SSL
- LPA
Regards
Hans
-
Normalizer Policy Runtime Usage Statistics?
Is it somehow possible to get runtime usage statistics from the normalizers?
What I want to see is:
How much time was spent within which Compiled Normalizer or Normalizer Package?
How many log messages where normalized with which Compiled Normalizer or Normalizer Package?
We have often seen performance issues due to poorly performing normalizer packages or compiled normalizers.
It would be much easier to figure out which normalizer is causing the performance issue here if you could see the above statistics.
This way you could identify runtime hotspots and perform optimizations.
Currently I do this manually by stopping a normalizer service and running it in the python debugger:
/opt/immune/bin/envdo /opt/immune/etc/env_bin/python -m pdb /opt/immune/installed/norm/apps/normalizer/normalizer.py /opt/immune/etc/config/normalizer_0/config.json

(Pdb)c
[wait a few seconds]
[press ctrl + c]
(Pdb)bt
(Pdb)list
(Pdb)display event
[check the currently processed log message] -
Updating of Applications
Hi,
I’m trying to find some information about updating applications. I have, for example, the Office365 application at version 5.0.1, and want to update it. This is on a production LP. What is the update process for applications/plugins?
Many thanks
-
Is it possible to share alert rules from "Used Rules"?
I’ve implemented some alerts by using Vendor Rules (via the “Use” action) and customizing them. But there is no action to share or change ownership of rules in the “Used Rules” view. Is it generally impossible to share those rules?
Maybe I don’t quite understand the purpose of “Used Rules”, shouldn’t the vendor rule by under “My Rules” once it has been customized?
-
TCP Keepalive & Dead Connection Detection
Hi
One of the changes from LogPoint 5 to 6 I was exited to see implemented, was the support for session keepalive in the syslog collector.
Most people do not think that much about it, but I would say that it is part of ensuring a stable operating environment.
Doing a 'netstat -ano | grep 514' in the CLI you will probably get something like the below listed:(I have pasted in the headlines as well as they will not show using '| grep')
Active Internet connections (servers and established)
Proto Recv-Q Send-Q Local Address Foreign Address State Timer
--------------
tcp6 0 0 :::514 :::* LISTEN off (0.00/0/0)
tcp6 0 0 172.20.20.20:514 172.20.10.107:50554 ESTABLISHED keepalive (7126.58/0/0)
tcp6 0 0 172.20.20.20:514 172.20.10.100:51662 ESTABLISHED keepalive (7126.58/0/0)
tcp6 0 0 172.20.20.20:514 172.25.20.42:50053 ESTABLISHED keepalive (7135.92/0/0)
---------------This shows the tcp syslog connections and that they are supporting keepalive.
7126.58 is the remaining life in seconds for that specific session - And this is where I realized that maybe LogPoint introduced keepalive, but they kept standard config, but then again this is also a question of tailoring values for the specific installation.
To understand a bit more of this you can try pasting the following command sequence in the CLI.
sysctl \
net.ipv4.tcp_keepalive_time \
net.ipv4.tcp_keepalive_intvl \
net.ipv4.tcp_keepalive_probesAnd you will now get something like the below.
-----------
net.ipv4.tcp_keepalive_time = 7200
net.ipv4.tcp_keepalive_intvl = 25
net.ipv4.tcp_keepalive_probes = 9
-----------TCP 7200 seconds is the standard TCP session length, and for a bit of explanation on these values, TCP keep-alive timer kicks in after the idle time of 7200 seconds. If the keep-alive messages are unsuccessful then they are retried at the interval of 25 seconds. After 9 successive retry failure, the connection will be brought down.
If you want to know a bit more on TCP keepalive and DCD(Dead Connection Detection) 'https://tldp.org/HOWTO/TCP-Keepalive-HOWTO/index.html' is a good place to visit.Knowing a bit about networks, I suspect that in most modern networks the communications between Log source and LogPoint Back-End/Collector/LPC-server will probably traverse one or more firewall or Load-Balancers, and here concurrent sessions are a scarce resource, and depending on firewall vendor default inactivity time-out for a session can be anything from 30 minutes to 1 hour, and Load-Balancers might even be more aggressive.
This typically result in sessions being torn down by the firewall or Load-Balancer, leaving initiating and receiving end without the knowledge their session has terminated.You might recognize some of the symptoms like the below snippet of an 'nxlog.log'file:
---------------
2021-08-23 11:22:23 ERROR couldn't connect to tcp socket on 10.9.9.9:514; A connection attempt failed because the connected party did not properly respond after a period of time, or established connection failed because connected host has failed to respond.
.
.
2021-10-14 09:50:12 ERROR couldn't connect to tcp socket on 10.9.9.9:514; No connection could be made because the target machine actively refused it.
.
.
.
2021-11-09 21:02:35 ERROR om_tcp send failed; An existing connection was forcibly closed by the remote host.
2021-11-09 21:02:36 INFO connecting to 10.9.9.9:514
2021-11-09 21:02:57 INFO reconnecting in 2 seconds
2021-11-09 21:02:57 ERROR couldn't connect to tcp socket on 10.9.9.9:514; A connection attempt failed because the connected party did not properly respond after a period of time, or established connection failed because connected host has failed to respond.
2021-11-09 21:02:59 INFO connecting to 10.9.9.9:514
---------------If you decide to do something about these issues, you can start out with investigating the communications path between you LogPoint Servers and your log sources, mapping inactivity time-out's and the decide for a optimal config of the TCP-stack on your LogPoint server.
Changing these values are not difficult at all.
Paste below sequence in to the CLI
----------
sysctl -w \
net.ipv4.tcp_keepalive_time=1500 \
net.ipv4.tcp_keepalive_intvl=60 \
net.ipv4.tcp_keepalive_probes=10
-----------Above commands only changes the current config, but will disappear at reboot.
The way to make the change permanent is to edit the 'etc/sysctl.conf' pasting below lines at the end of the file.
---------
net.ipv4.tcp_keepalive_time = 1500
net.ipv4.tcp_keepalive_intvl = 60
net.ipv4.tcp_keepalive_probes = 10
--------The steps taken in this article does not just go for your LogPoint installation.
For my part I realized then years back, when I was troubleshooting intermittent failures in applications communicating with database severs.
Regards
Hans -
LPA Agents status
Hi
I got this Python script from Mingma in LogPoint support, and think it is such a great utility, that it would be a pity if it is not available for others in the LogPoint community.
It makes a csv-file of the info from the 'Agents' section of the 'LogPoint Agent Plugin' listing:
"Device Name, Template, Source, Encryption, Last Config Update, Status"
This can be used for different purposes like for example documenting to the the Agents status to the customer.Regards
Hans
-
Email Alerts search-link
Hi There!
Is there a way to have my logpoint server to use its url name instead of IP-address in the alert-mail search-link?
regards Fredrik
-
VM IOPS requirement
Hey,
I’m trying to find information on the required/recommended IOPS for both hypervisor-hosted LPs and cloud-hosted VMs.
Many thanks,
-
change the password WEB from the CLI
Hello,
I lost my password GUI , I can access to logpoint just via CLI ,
How I can reset my GUI password
thanks
-
"/opt/makalu/storage" grows and grows and grows
Hi,
since I installed Logpoint 6.12 three weeks ago, "/opt/makalu/storage" grew from 47 % to 89 %.
Does anyone have the same issue?
Best regards,
Hans Vedder
-
KPI
I want to define the KPI ( Key Performance indicators )for each equipment in the dashboard, how can I proceed?
-
How to see a result whith "filter < ..."
Hi,
every hour my firewall loads a new antivir database. In normal case, I receive 24 logs a day. When the download fails, I don’t receive any log.
Now I want to be informed when the count of logs are less than 20 a day.
I tried the following:
norm_id=FortiOS event_category=kevent sub_category=update message="Update result: virus db:yes*" | chart count() as "Count" by message | filter "Count" < 20
but this query doesn’t show my any results. I would like to see message and Count.
What should I modify?
Best regards,
Hans Vedder
-
Using geoip at drilldown
Hi,
at
Kalyan Bhetwal provided the following query:
norm_id=* destination_address=* -destination_address in HOMENET | chart count() by destination_address, country order by count() desc limit 10 | process geoip(destination_address) as country
To my comment “With the ‘new’ query it's not possible to make a drill down.” he wrote:
We will have a new feature in upcoming version of logpoint where the geoip used after chart count() will also be present in drilldown. This will solve the drilldown problem.
What about the new feature? At the moment, it’s still not possible to make a drill down.
I use Logpiont 6.12.1.
Best regards,
Hans Vedder
-
Import Microsoft SCCM logs?
Im looking to import the various SCCM log files, but there doesnt appear to be a normaliser or an obvious way to do this. Has anyone else done this?
I’m mainly interested in the last client communication an the last patching updates and attempts as part of a bigger piece of work to compare last communications from various different sources.
User groups in Zendesk Community allow members to connect, share insights, ask questions, and collaborate within specific interest areas.