Welcome to Logpoint Community
Connect, share insights, ask questions, and discuss all things about Logpoint products with fellow users.
-
Debian Normalizers
I want to add some Linux Logs to Logpoint and I have seen that there are so many different normalizers that the testing would be take forever . . .
Has somebody a best practice normalizers for a default Debian rsyslog configuration?
-
ThinkIn - Alerts and Widgets
Please find the material presented during the 2021 ThinkIn session on Alerts and Widgets attached to this article as well as the complete video recording from the session on Youtube via this link:
https://www.youtube.com/watch?v=I2OvY72XtrY
The scripts mentioned during the presentation can also be downloaded from here.
A few words on each of the scripts.
pm_analyzer.py
The primary purpose of the pm_analyzer.py script is to provide information about the performance of each livesearch. It is usually run interactively from the shell on systems experiencing performance issues with livesearches - widgets not updating, or alerts not firing as they should.
Although the script will need to run for as long as the longest update cycle for any livesearch takes (which it doesn't inform about - yet) to provide complete information on all livesearches - on most systems the issues would probably become evident sooner as the performance would most likely be impacted by resource hogs that are updating frequently and therefore become visible faster.
The script uses tcpdump on the merger port lo:5555 port and therefore requires root privileges to run.
premerger_mon.py
This script will read the premerger configuration and based on that information monitor the merger port lo:5555 to verify that the premerger is actually doing what is in the configuration and report into /var/log/syslog if a livesearch is missed or delayed (currently set to warn when a livesearch is . The script is designed to run from /root via cron - and will require root privileges to run as is uses tcpdump on lo:5555.
The header of the script will instruct how to setup the root crontab to get it to run properly - basically add the following line too root crontab using the crontab command:
life.py
This script is an improved version of the somewhat "hidden" script named lifegrp.py which is/was part of the premerger service installation. The script doesn't need privileges to run and will perform a lookup on a given life_id or lifegrp to list information about the owner, query, repo selection, time range etc of the livesearch - this can be used to identify potential optimisations and direct the information towards the owner of the livesearch.
The scripts will be updated occasionally so do drop by when in the neighborhood ;-)
Questions are always welcome!
Enjoy!
Peter Melsen
-
Think In content available now!
Once again, a big thank you from all of us for joining LogPoint’s ThinkIn 2021!
We have collected all of the great keynotes, presentations, and breakout sessions for you to revisit: Thinkin 2021 recordings
If you haven’t already provided your feedback on Thinkin 2021, we would very much appreciate a few minutes of your time: Take the ThinkIn 2021 survey
See you for ThinkIn 2022… -
Your thoughts on Printnightmare?
Bhabesh Raj, our Associate Security Analytics Engineer at LogPoint recently shared his thoughts on how to prepare to fend off PrintNightmare with LogPoint. Do you have any experience with PrinterNightmare? If so, share your advise or input for your fellow LogPoint users :)
The blog post can be reached on the link below:
Preparing your defenses against the terror of PrintNightmare (5 minutes read)
-
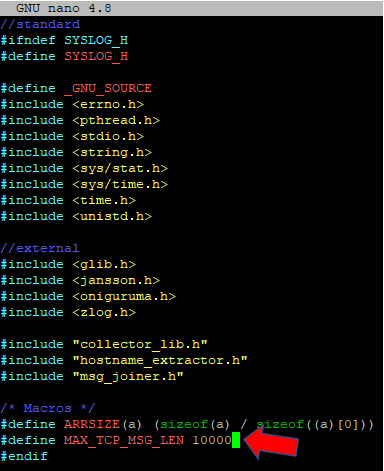
Howto: Increase maximum size of syslog message
In the default configuration the syslog_collector process only accepts messages (log lines) with a maximum of 10000 bytes (characters). This results in truncated messages and thus they will not be normalized correctly. Especially powershell script blocks may contain important information, but generate very long log messages.
Unfortunately this is a fixed value in the syslog_collector binary.
At least the c code is avialable in the system and you can adjust the values and compile the binary again.For this you need sudo/root access.
sudo -i # become root
cd /opt/immune/installed/col/apps/collector_c/syslog_collector/
cp syslog_collector.h syslog_collector.h.bak # create a backup of the file
nano syslog_collector.h
change the value here in this line:
compile the syslog collector using:/opt/immune/bin/envdo make clean
/opt/immune/bin/envdo make
sv restart /opt/immune/etc/service/syslog_collector/ # restart the serviceIt would be a great feature to be able to set this value within the web UI.
-
Sample Template for multiple Public Widgets on the same web page
Sometimes it is necessary to publish LP widgets on a central screen/monitor without having to authenticate the user. LogPoint has a built-in feature to publish URL’s that are Public - i.e. no authentication is needed.
This is a great feature, but also implies that only one widget can be displayed on the whole browser. To accommodate this and enable multiple widgets on the same browser page, one can use a template HTML page that contains multiple URL’s that are included with the HTML tag <iframe>. Each <iframe> tag can display a widget, and thus we can have multiple public widgets on the same Web page.
Below is an embryo for such a template. In the example below, there are two <iframe> tags that correspond to two different Public URL’s. The nice thing is that the size and placement of each <iframe> can be specified by using <iframe> attributes. The details of the tag attributes are out of scope for this post, but more information about them can be found here:
https://www.w3schools.com/tags/tag_iframe.asp
If you want to add more widgets on the same page, simply copy from ‘<iframe>’ until the next ‘</iframe>’ and adjust the attributes as you need (most likely ‘width=’ and ‘height=’). And you need to specify the correct Public URL in the ‘src=’ attribute.
The ‘<br>’ tag indicate a Break - i.e. a new line will be used for the following ‘<iframe’>.
<html>
<head>
<!--
A simple HTML template to insert multiple LogPoint Public Widgets URLs on the same page. Useful for 'Always On Monitors' to display relevant Widgets.
Mike Blomgren, LogPoint, 2021-06-31


To insert additional Widgets, just copy from <iframe ..... until ... </iframe> and modify the URL to point to the Public URL.

Sample:
<iframe src="https://<public URL>" width="600px" height="300px">
</iframe>

Change the Width and Height values to accomodate the desired Widget size in pixels.

The '<br>' tag inserts a new line, to display widgets beneath each other.

Change the refresh "content" value (in seconds) to set the refresh interval (sometimes not needed, though).


-->

<meta http-equiv="refresh" content="30">
</head>
<body>

<iframe src="https://<public LP Widget URL>" width="600px" height="300px">
</iframe>
<br>
<iframe src="https://<public LP Widget URL>" width="50%" height="400px">
</iframe>


</body>
</html> -
More Fields in Stream Search with "having same"?
When I'm using a search query like this:
[5 event_id=1234 having same user]I'm getting a grouped result with only log_ts and user as normalized fields for this group.
Is it possible to get more fields similar to SQL with the
select FIELDS where CONDITIONAt the moment I'm "workarounding" this with joining the first search with another search. But this seems to be extremly inefficient because it uses the analyzer process which itself relies on slow leveldb operations:
[5 event_id=1234 having same user] as s1 join [event_id=1234] as s2 on s1.user = s2.userIs there a better solution?
The problem with 'having same' is, that the search result only contains the fields specified in the 'having same' clause. But in this special case the 'service' field should be different, not the same. So specifying it in a comma separate list (like '...having same user,service...') doesn't help here.
It would be great to access all the other fields in a following 'chart count()' etc.
-
n8n: Fetching Incidents via Director API
Has anyone of you experience with the open source workflow tool n8n ? And was also able to fetch incidents via the Director API and has built a n8n workflow which is also considering some error handling (token refresh, HTTP errors during polling etc.)?
I have built a PoC workflow which seem to work to fetch incidents, but it is in a very early stage . Maybe we (the community) can try to build a nice workflow which can be used by everyone here?
The workflow looks like this:
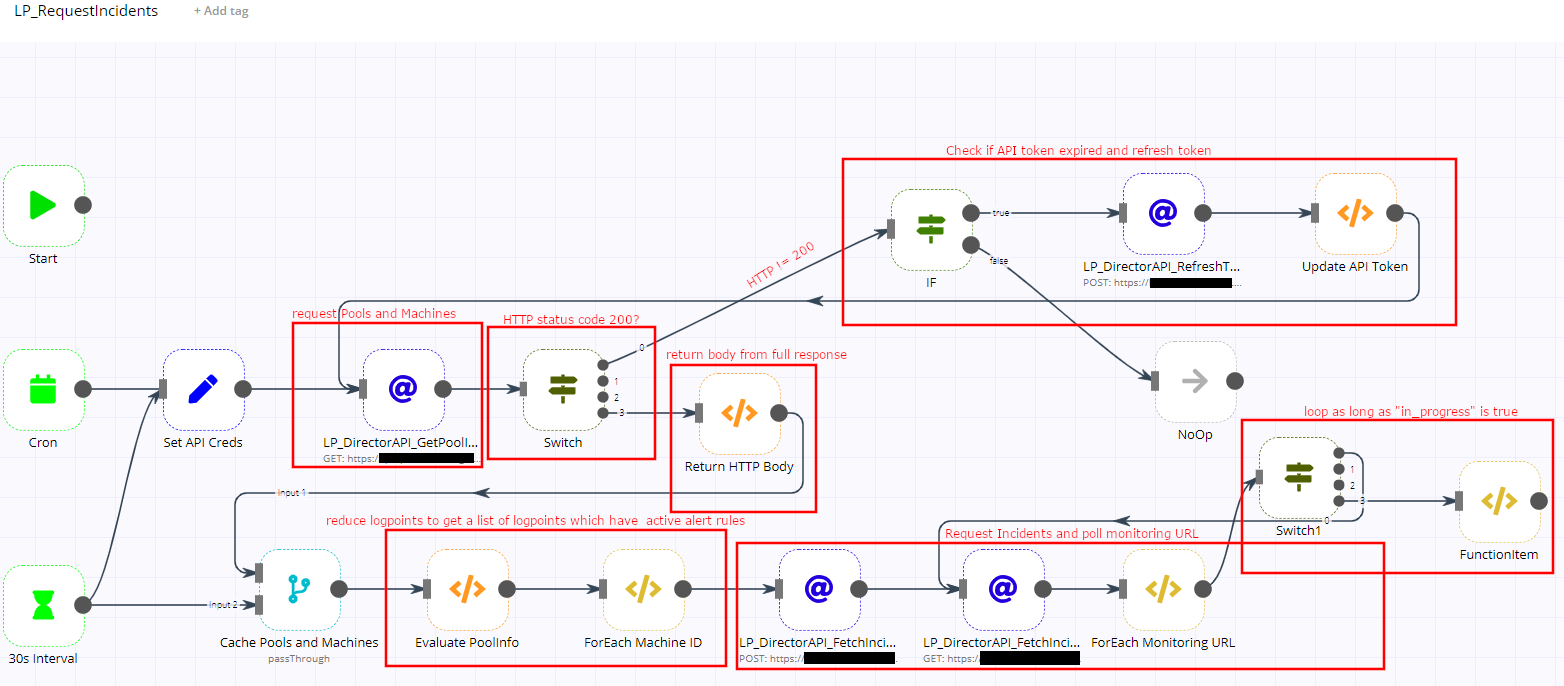
n8n Director IP Incident Fetch Workflow You have to replace “<LP-API-URL>”, "<YOUR SECRET>" and "<YOUR TOKEN>" befor importing it to n8n:
{
  "name": "LP_RequestIncidents",
  "nodes": [
    {
      "parameters": {},
      "name": "Start",
      "type": "n8n-nodes-base.start",
      "typeVersion": 1,
      "position": [
        110,
        -140
      ]
    },
    {
      "parameters": {
        "authentication": "headerAuth",
        "url": "https://<LP-API-URL>/monitorapi/v1/director/poolinfo",
        "allowUnauthorizedCerts": true,
        "options": {
          "fullResponse": true
        }
      },
      "name": "LP_DirectorAPI_GetPoolInfo",
      "type": "n8n-nodes-base.httpRequest",
      "typeVersion": 1,
      "position": [
        560,
        90
      ],
      "credentials": {
        "httpHeaderAuth": "LogPoint Director API"
      }
    },
    {
      "parameters": {
        "authentication": "headerAuth",
        "requestMethod": "POST",
        "url": "=https://<LP-API-URL>/configapi/{{$node[\"ForEach Machine ID\"].json[\"pool_uuid\"]}}/{{$node[\"ForEach Machine ID\"].json[\"machine_uuid\"]}}/Incidents/fetch",
        "allowUnauthorizedCerts": true,
        "jsonParameters": true,
        "options": {
          "bodyContentType": "json"
        },
        "bodyParametersJson": "={\n  \"data\": {\n    \"status\": [\n      \"unresolved\"\n    ],\n    \"type\": [\n      \"alert\"\n    ],\n    \"start_date\": {{parseInt(new Date().getTime() / 1000) - 30 * 24 * 60 * 60}},\n    \"end_date\": {{parseInt(new Date().getTime() / 1000)}}\n  }\n}"
      },
      "name": "LP_DirectorAPI_FetchIncidents",
      "type": "n8n-nodes-base.httpRequest",
      "typeVersion": 1,
      "position": [
        1080,
        340
      ],
      "credentials": {
        "httpHeaderAuth": "LogPoint Director API"
      }
    },
    {
      "parameters": {
        "interval": 30
      },
      "name": "30s Interval",
      "type": "n8n-nodes-base.interval",
      "typeVersion": 1,
      "position": [
        110,
        360
      ]
    },
    {
      "parameters": {
        "functionCode": "incidentMachines = [];\nitems.forEach(function(item) {\n  pool = item.json;\n  if (pool['active'] == true) {\n    poolMachines = pool['machines'];\n    // if pool only has one machine, this is the search head and backend:\n    if (poolMachines.length == 1) {\n      machine = poolMachines[0];\n      incidentMachines.push({'pool_name': pool['name'], 'pool_uuid': pool['pool_uuid'], 'machine_name': machine['name'], 'machine_uuid': machine['identifier']});\n    } else { // go through all machines and check some naming conventions to differ DLP and collectors:\n      poolMachines.forEach(function(machine) {\n        if ((!machine['name'].includes('col')) && (machine['name'].includes('backend') || machine['name'].includes('be') || machine['name'].includes('siem') || machine['name'].includes('search') || machine['name'].includes('sh'))) {\n          incidentMachines.push({'pool_name': pool['name'], 'pool_uuid': pool['pool_uuid'], 'machine_name': machine['name'], 'machine_uuid': machine['identifier']});\n        }\n      });\n    }\n  }\n});\n\n// this is important to return single items!!\nreturn incidentMachines.map((item) => {\n  return { json: item};\n});\n\n"
      },
      "name": "Evaluate PoolInfo",
      "type": "n8n-nodes-base.function",
      "typeVersion": 1,
      "position": [
        640,
        340
      ]
    },
    {
      "parameters": {
        "functionCode": "return item;"
      },
      "name": "ForEach Machine ID",
      "type": "n8n-nodes-base.functionItem",
      "typeVersion": 1,
      "position": [
        860,
        340
      ]
    },
    {
      "parameters": {
        "triggerTimes": {
          "item": [
            {
              "mode": "everyHour"
            }
          ]
        }
      },
      "name": "Cron",
      "type": "n8n-nodes-base.cron",
      "typeVersion": 1,
      "position": [
        110,
        90
      ]
    },
    {
      "parameters": {
        "mode": "passThrough"
      },
      "name": "Cache Pools and Machines",
      "type": "n8n-nodes-base.merge",
      "typeVersion": 1,
      "position": [
        430,
        340
      ]
    },
    {
      "parameters": {
        "authentication": "headerAuth",
        "url": "=https://<LP-API-URL>/{{$node[\"LP_DirectorAPI_FetchIncidents\"].json[\"message\"]}}",
        "allowUnauthorizedCerts": true,
        "options": {}
      },
      "name": "LP_DirectorAPI_FetchIncidentsMonitoring",
      "type": "n8n-nodes-base.httpRequest",
      "typeVersion": 1,
      "position": [
        1310,
        340
      ],
      "credentials": {
        "httpHeaderAuth": "LogPoint Director API"
      }
    },
    {
      "parameters": {
        "value1": "={{$json[\"statusCode\"]}}",
        "rules": {
          "rules": [
            {
              "operation": "equal",
              "value2": 200,
              "output": 3
            }
          ]
        },
        "fallbackOutput": 0
      },
      "name": "Switch",
      "type": "n8n-nodes-base.switch",
      "typeVersion": 1,
      "position": [
        760,
        90
      ]
    },
    {
      "parameters": {
        "conditions": {
          "string": [
            {
              "value1": "={{$json[\"statusMessage\"]}}",
              "operation": "contains",
              "value2": "Expired token"
            }
          ]
        }
      },
      "name": "IF",
      "type": "n8n-nodes-base.if",
      "typeVersion": 1,
      "position": [
        1220,
        -110
      ]
    },
    {
      "parameters": {
        "functionCode": "console.log(items);\n\n// this is important to return single items!!\nreturn items[0].json['body'].map((item) => {\n  return { json: item};\n});\n"
      },
      "name": "Return HTTP Body",
      "type": "n8n-nodes-base.function",
      "typeVersion": 1,
      "position": [
        980,
        120
      ]
    },
    {
      "parameters": {
        "authentication": "headerAuth",
        "requestMethod": "POST",
        "url": "=https://<LP-API-URL>/configapi/RefreshToken",
        "allowUnauthorizedCerts": true,
        "jsonParameters": true,
        "options": {},
        "bodyParametersJson": "={\"secretKey\": \"{{$node[\"Set API Creds\"].parameter[\"values\"][\"string\"][0][\"value\"]}}\"}"
      },
      "name": "LP_DirectorAPI_RefreshToken",
      "type": "n8n-nodes-base.httpRequest",
      "typeVersion": 1,
      "position": [
        1510,
        -130
      ],
      "credentials": {
        "httpHeaderAuth": "LogPoint Director API"
      }
    },
    {
      "parameters": {
        "values": {
          "string": [
            {
              "name": "api.secretKey",
              "value": "<YOUR SECRET>"
            },
            {
              "name": "api.token",
              "value": "<YOUR TOKEN>"
            }
          ]
        },
        "options": {
          "dotNotation": true
        }
      },
      "name": "Set API Creds",
      "type": "n8n-nodes-base.set",
      "typeVersion": 1,
      "position": [
        310,
        90
      ]
    },
    {
      "parameters": {
        "functionCode": "console.log(items);\n\nreturn items;"
      },
      "name": "Update API Token",
      "type": "n8n-nodes-base.function",
      "typeVersion": 1,
      "position": [
        1750,
        -130
      ]
    },
    {
      "parameters": {},
      "name": "NoOp",
      "type": "n8n-nodes-base.noOp",
      "typeVersion": 1,
      "position": [
        1550,
        80
      ]
    },
    {
      "parameters": {
        "functionCode": "return item;\n"
      },
      "name": "ForEach Monitoring URL",
      "type": "n8n-nodes-base.functionItem",
      "typeVersion": 1,
      "position": [
        1510,
        340
      ]
    },
    {
      "parameters": {
        "dataType": "boolean",
        "value1": "={{$json[\"request\"][\"in_progress\"]}}",
        "rules": {
          "rules": [
            {
              "value2": true
            }
          ]
        },
        "fallbackOutput": 3
      },
      "name": "Switch1",
      "type": "n8n-nodes-base.switch",
      "typeVersion": 1,
      "position": [
        1680,
        200
      ]
    },
    {
      "parameters": {
        "functionCode": "\nconsole.log(item);\n\nreturn item;"
      },
      "name": "FunctionItem",
      "type": "n8n-nodes-base.functionItem",
      "typeVersion": 1,
      "position": [
        1930,
        230
      ]
    }
  ],
  "connections": {
    "LP_DirectorAPI_GetPoolInfo": {
      "main": [
        [
          {
            "node": "Switch",
            "type": "main",
            "index": 0
          }
        ]
      ]
    },
    "30s Interval": {
      "main": [
        [
          {
            "node": "Cache Pools and Machines",
            "type": "main",
            "index": 1
          },
          {
            "node": "Set API Creds",
            "type": "main",
            "index": 0
          }
        ]
      ]
    },
    "Evaluate PoolInfo": {
      "main": [
        [
          {
            "node": "ForEach Machine ID",
            "type": "main",
            "index": 0
          }
        ]
      ]
    },
    "ForEach Machine ID": {
      "main": [
        [
          {
            "node": "LP_DirectorAPI_FetchIncidents",
            "type": "main",
            "index": 0
          }
        ]
      ]
    },
    "Cache Pools and Machines": {
      "main": [
        [
          {
            "node": "Evaluate PoolInfo",
            "type": "main",
            "index": 0
          }
        ]
      ]
    },
    "LP_DirectorAPI_FetchIncidents": {
      "main": [
        [
          {
            "node": "LP_DirectorAPI_FetchIncidentsMonitoring",
            "type": "main",
            "index": 0
          }
        ]
      ]
    },
    "LP_DirectorAPI_FetchIncidentsMonitoring": {
      "main": [
        [
          {
            "node": "ForEach Monitoring URL",
            "type": "main",
            "index": 0
          }
        ]
      ]
    },
    "Switch": {
      "main": [
        [
          {
            "node": "IF",
            "type": "main",
            "index": 0
          }
        ],
        [],
        [],
        [
          {
            "node": "Return HTTP Body",
            "type": "main",
            "index": 0
          }
        ]
      ]
    },
    "Return HTTP Body": {
      "main": [
        [
          {
            "node": "Cache Pools and Machines",
            "type": "main",
            "index": 0
          }
        ]
      ]
    },
    "IF": {
      "main": [
        [
          {
            "node": "LP_DirectorAPI_RefreshToken",
            "type": "main",
            "index": 0
          }
        ],
        [
          {
            "node": "NoOp",
            "type": "main",
            "index": 0
          }
        ]
      ]
    },
    "Set API Creds": {
      "main": [
        [
          {
            "node": "LP_DirectorAPI_GetPoolInfo",
            "type": "main",
            "index": 0
          }
        ]
      ]
    },
    "LP_DirectorAPI_RefreshToken": {
      "main": [
        [
          {
            "node": "Update API Token",
            "type": "main",
            "index": 0
          }
        ]
      ]
    },
    "Update API Token": {
      "main": [
        [
          {
            "node": "LP_DirectorAPI_GetPoolInfo",
            "type": "main",
            "index": 0
          }
        ]
      ]
    },
    "ForEach Monitoring URL": {
      "main": [
        [
          {
            "node": "Switch1",
            "type": "main",
            "index": 0
          }
        ]
      ]
    },
    "Switch1": {
      "main": [
        [
          {
            "node": "LP_DirectorAPI_FetchIncidentsMonitoring",
            "type": "main",
            "index": 0
          }
        ],
        [],
        [],
        [
          {
            "node": "FunctionItem",
            "type": "main",
            "index": 0
          }
        ]
      ]
    }
  },
  "active": true,
  "settings": {},
  "id": "1"
} -
Discussion: How do you implement Clients in DHCP networks?
In our internal research team we obsevered that it is of extremly high importance to have the logs of the client systems collected in your SIEM. Especially of the windows systems, in the best case with sysmon together with a sophisticated sysmon configuration.
The majority of large scale “attacks” doesn’t utilize any strange “cyber hacking voodoo”, but uses simple “human naivity” as initial code execution trigger. Like a “mouse click” to “enable content” of a microsoft office document with VBA macros, which was delivered via email from the attackers. The following malware download, its execution, reconnaissance and lateral movement steps can be easily detected with a good sysmon configuration. And this in “real time”, before any harm was done or your IDS may throw alerts.
The main issue is, that clients are typically flexible/mobile systems, which are connecting your enterprise network via different network IP ranges (several LANs, Wifi, VPN, WAN etc.).
As the current logpoint design requires either static IPs or whole network ranges, this completely blows up the license model, as you may have a /21 network (for example) with only 100 active devices in it.
I added a feature request a while back, where I request to re-design the LPagent, or, to be more specific, the logpoint configuration module on top of the nxlog used as LPagent.
At the moment the LPagent is inconvenient, as it runs a web server on the log source/device/client to accept connections from the logpoint datanode, which then pushes the nxlog configuration to the log source. This requires windows firewall rules for incoming connections etc.
Also this is only possible with static IP devices, because the LP datanode acts as HTTP client and thus needs to know the unique device IP to connect to its web server and push the nxlog config. So this eliminates the usage on the flexibel client systems.
My idea was to replace the web server by a web client in the first place, so that the LPagent is connecting to the LP datanode (or multiple for load balancing or network separation), instead of the other way around. This reduces the complexity of the LPagent enormously and resolves the firewalling and the static IP issue.
On the LP datanode side, an agent authentication token should be generated (either one for all devices, or for device groups) and an API endpoint has to be implemented, which accepts connections from LPagents from different configurable IP networks.
The LPagent shall receive the agent authentication token during its installation (either in the installer GUI or as CLI parameter so it could be done via group policy or central software control solutions). This token could then be used to make an initial agent configuration and identification (e.g. with exchanging a TLS client certificate, agent/client UUID etc.).This would solve the license and IP issue on the LP datanode side, as the LP datanode then could see the total number of individual active devices according to the agent identification (e.g a agent UUID) and claim the correct amount of licenses. So the LPagent would become IP independent, when using the agent authentication token.
Even WAN log collection could be possible then (via specially secured connection of course) if you place a collector in your DMZ.
So my question to the community is: Are you collecting logs from clients, and if so, how are you doing it?
My only idea at the moment is to use nxlog 5 with a manual configuration, and add multiple collector IPs (this is possible since nxlog 5) for the different possible networks (LAN, VPN, Wifi...). But this would explode the license number, if you have a large network.
-
Support-Connection - HTTP Proxy settings
Hi,
i will need to open a support ticket with LP in the near future as the /opt folder does not have enough free space anymore which prevents the 6.11 updates from being applied.
According to the LP documentation following fw rules have to be configured to successfully create a support connection:
reverse.logpoint.dk - 1193/UDP
customer.logpoint.com - 443/TCP
My first question:
Are these rules still correct ? reverse.logpoint.dk does not seem to exist anymore. Adding these rules to our firewall would not allow our LogPoint to retrieve a support IP.
Second question:
I guess that 443/TCP is needed to send some HTTPS traffic back to Logpoint. However, all HTTPS traffic in our network is routed through a forward proxy, and i would like to prevent making an exception for our LPs if it is avoidable. But i can not find any setting in the web-gui allowing me to configure a http proxy on the LogPoint. Is it possible to configure a system wide http proxy via the web-gui or the command line ? Please mind, we only have command line access for li-admin, not full root privileges.
Third question:
I found a CLI tool for establishing a remote connection in the LP docs somewhere, yet for another product (i think it is LP Director), called start-support .
Though undocumented, it seems to work in LP. Can i use it to establish a remote connection (if so, i think exporting the http_proxy variable for li-admin should be sufficient, as the start-support tool will run as user li-admin also), or does it something different ?
Regards
Andre
-
Rules for monitoring attacks against web apps
Hi all,
I’ve been through the provided vendor rules in Logpoint and they are not useful. Does anyone have any rules that they can share that detect the attacks mentioned in the OWASP top 10?
Thank you
-
ThinkIn feedback wanted
A big thank you from all of us for joining LogPoint’s ThinkIn 2021!
As we’re always striving to improve and make the next edition of ThinkIn even better, we would very much appreciate your feedback on ThinkIn 2021.
Please take a few minutes to share your impressions here in the comments section or Take the ThinkIn 2021 survey
If you want to revisit ThinkIn 2021, you can find live recordings of main tracks for the two days here:
ThinkIn 2021 – Day 1
ThinkIn 2021 – Day 2Stay tuned for recordings of individual keynotes, presentations, and breakout sessions.
-
Fetching logs from Oracle Database table
Can we fetch logs from oracle database, where there is no incremental key? I am thinking about, fetching logs from database table on daily basis once.
Can it be possible with logpoint?
-
Installation of Logpoint in AIX machine
Can we install Logpoint in AIX machine 7.2?
-
Sharing evolution ideas/feature requests with the community
Good morning LogPoint Community !
LogPoint Community seems to be (after less than a day of exploration) a great place to share with other LogPoint users.
But, and I think I saw this possibility in the Community presentation during ThinkIn yesterday, I’m missing a way to share feature requests we might have asked to LogPoint Support with the Community.
This can be an interesting way, I think, for LogPoint users to share ideas we had and maybe also for us to influence the LogPoint roadmap by showing interest we might have to such feature requests using votes.
Is this kind of “User Voice” planned for the Community website in a near future ?
Kind regards,
Louis -
Threat_Intelligence
My Endpoint devices shows source_address as client_ip? How can I use threat_intelligence for matching source_address as client_ip? I have used rename for enrichingthose threat_intelligence logs, but failed to do so?
How can I use endpoint hashes as well for enriching threat_intelligence logs?
-
Does LDAP Authentication support nested groups?
Does the LDAP Authentication support nested groups from AD?
-
How to correct blank dashboard widgets?
A dashboard can go blank for various reasons, check the following things to correct the blank dashboard before contacting LogPoint Support.
- Hit the query that is being used by the dashboard in the search bar and check if it has any matching logs.
- If you do not find any matching logs, then there is a chance that correct normalization packages are not in place for the corresponding normalization policy.
- If logs are shown and the dashboard is still blank, check if the source devices are configured to the correct time zone from the device configuration settings.
- If the widget is still empty even after correcting the timezone of a device, try to add a “dummy dashboard“ or try to edit that specific dashboard. It will trigger the dashboard engine to regenerate the config and also helps to check if there is a problem with a single dashboard or in dashboards in general.
-
If the widget is still blank, create a support ticket with the below information:
- The query being used in the dashboard.
- Timerange of the query.
- Logs inside /opt/immune/var/log/service/premerger/current. If query used is correlation query then also include logs from file /opt/immune/var/log/service/analyzer/current.
-
How to configure a new Zpool?
1. Decide the mode you want to configure zpool in (normal, mirror, raidz) and prepare the disks accordingly.
2. Set all the disks label to GPT:
parted /dev/sdX # get disk-id or disk-path from /dev/disk/by-id or /dev/disk/by-path
mklabel gpt
3. Create a new zpool with following command:
zpool create -o ashift=12 -O atime=off -O canmount=off -O compression=lz4 data_pool /dev/disk/by-id/<disk-id>
if in raidz mode, at least 3 disks are needed:
zpool create -o ashift=12 -O atime=off -O canmount=off -O compression=lz4 data_pool raidz /dev/disk/by-id/<disk1-id> /dev/disk/by-id/<disk2-id> /dev/disk/by-id/<disk3-id>
in mirror mode, at least two disks are needed.
zpool create -o ashift=12 -O atime=off -O canmount=off -O compression=lz4 data_pool mirror /dev/disk/by-id/<disk1-id> /dev/disk/by-id/<disk2-id>
4. Mount the pool to appropriate mountpoint:
zfs create -o mountpoint=<mount_point> <poolName>/<filesystemName>
eg. zfs create -o mountpoint=/data/store Tank1/primary
5. Add the mount point to repo path. From li-admin, run:
repodir add <mount_point>
eg. repodir add /data/store
-
Creation of a new normalization request
When creating a new normalization request, please include the following information to accelerate the norm package creation process:
- Name and version of the log source
- Logging documentation for the version of the log source (can be obtained from the device vendor)
- Sample logs from the device (The sample logs can be anonymised before being provided on the request)
Notes: You can use the following query to extract the un-normalized sample logs from the UI of LogPoint
device_ip='xx.xx.xx.xx' -norm_id=* | norm <ALL:.*> | fields ALL
-
Logpoint Patch Update Failed
Before running any upgrades, it is always recommended that you go through the release notes, and check up on any important notices that have been included. It is also important that you verify the upgrade pak file's SHA256 present on the release notes to that on LogPoint.
If you are using a virtual machine to run LogPoint, it is highly advised that you take a snapshot before running the upgrade. This is to make sure that you have a point to rollback if the upgrade runs into any issues.
If the upgrade does fail, please reach out to the LogPoint support team with the output of the following commands provided on a new HelpCenter request:
- tail -n 20 /opt/immune/var/patches/log/*6.10.0*.log (Replace the version of the LogPoint upgrade which failed)
- tail -n 20 /var/log/*6.10.0*.log (Replace the version of the LogPoint upgrade which failed)
Note: Please do not attempt a server reboot during the upgrade process, unless discussed prior with the support team.
-
LPA configuration not being pushed
There may be numerous reasons for the LPA configuration to not be pushed from LogPoint to the agents. The following are some of the things that you can easily check before contacting LogPoint Support.
- Check if the Windows machine is actually running or not. This might seem trivial, but there are instances where the windows machines are not functioning in the first place.
- Run the telnet command on the device for port 7994 and 7995. Since these are the ports via which the configurations are pushed, this might be an issue with the lpagents which are deployed on the log source. You can also check if ports 7994 or 7995 are open on the device's end as well.
- Verify that the configured device is not configured as NAT IP. If NAT IPs are being used, then the configuration will need to be copied manually to the correct directory; C:\Program Files (x86)\lpagent\conf\lpagent.conf
-
If the configuration is still not being pushed, create a support ticket with the below information:
- LPAgent log files present on C:\Program Files (x86)\lpagent\data\lpagent.log
- Logs present on /opt/immune/var/log/service/lpa_manager/current
-
Browser reads “Error 500“
If the browser reads Error 500, the following can be checked.
- If the LogPoint server has just been booted up, the system will take some time to get the services up and running. Hence, simply waiting for 2-3 minutes should work in most cases.
- Check the disk space utilization on the CLI using the command df -hT . If the /opt partition has less then 3.5GB, or the /opt/immune/storage or the root partition is at 100% utilization, this behavior may be seen. If this is the case, then either adding additional space or removing some of the files will be required. For this, the sudo access might be required, if so, then please create a support ticket with LogPoint Support.
-
If you are still not getting the UI to respond, then please create a new support ticket with the below information
- Output of the df -hT command
- Logs inside /opt/immune/var/log/service/webserver/current and /opt/immune/var/log/service/mongodb/current
-
Blank UEBA Dashboard
Please carry out the following steps if the UEBA dashboard is blank.
1) Check the Settings>System>System Settings under the General tab. If the Apply Timerange On is selected to col_ts , change it to log_ts and check the dashboard again.
2) Go to the page Settings>Configuration>UEBA Board>Overview. Check the values of logs sent since last day, if all these values are zero, refer to <another community post:
3) Go to the search tab and see if any data is present in the uebaoutput repo for the last 24 hours. If no data is present, make a support request to LogPoint complaining about the unavailability of analytics result.
-
UEBA data is not being uploaded
If you found out that the logs sent since last day values are all zero in Settings>Configuration>UEBA Board>Overview follow the given steps.
1) Confirm that the UEBA dockers are running properly. The following command should output a list of 3 dockers running:
docker ps
2) Run tcpdump in the port 5532 of data server. If data are coming in, check if your firewall is blocking the connection to UEBA cluster. The IPs of UEBA cluster are provided during UEBA onboarding.
tcpdump -Aqs0 -i any port 5532
3) If there is no data in 5532, run tcpdump on the port 5530 and see if data is coming into the port. If data is flowing in, there is a possible a problem with licensing. Please check the Settings>Configuration>UEBA Board>Entity Selection and check from the search tab that the logs belonging to the selected Entities are actually present. Then, please make correct entity selection.
4) If data are not flowing into 5530, there is problem with log collection. Please contact LogPoint support.
-
Query chaining and available fields
Fields available in simple search
The search queries with field=value, word(s), phrases or logical combination of such without any use of "|" commands are defined as simple search. Each result row in the result of a simple search query can be taken as a set of field=value pairs and the actual logs. All the field=value pairs that are generated during normalization can be accessed. In addition, the following fields are added by default; log_ts, col_ts, device_name,device_ip,col_type.
example: Users failing to login
label=User label=Login label=Fail
Fields available in aggregation query resultsThere may be use-cases where a simple search doesn't suffice and there‘s a need to make aggregations based on one or more fields.
Example:
label=User label=Login label=Fail | chart count() as FailCount by target_user
The result of this query is a set of target_user values and the corresponding count, represented as FailCount. Only these two variables are available at this stage. If you want to make a search of results with fails more than hundred then you can do the following.
label=User label=Login label=Fail | chart count() as FailCount by target_user | search FailCount>100
Let's take a non-working example.label=Allowed label=Connection | chart count() as CNT by source_address,destination_address | search destination_port <1024
The result of the query "label=Allowed label=Connection" will be a set of logs and field-value pairs and destination_port will also be contained on each result row. However, when "| chart count() as CNT by source_address,destination_address" is done we are basically reducing the result set in such a way that each row consists of three field-value pairs viz source_address,destination_address,CNT. This can also be seen as a table with 3 columns. If you now need to search for all connections that went to ports below 1024 you can't do "| search destination_port <1024" because the field destination_port is not available at this stage.
If you need to make search on the destination_port then you can do the following.
label=Allowed label=Connection | chart count() as CNT by source_address,destination_address,destination_port | search destination_port <1024 | chart sum(CNT) by source_address,destination_address
To make the destination_port available for the search segment "| search destination_port < 1024" we explicitly carried that in the first aggregation. We then filtered out all rows corresponding to destination_port < 1024 with the query "| search destination_port <1024". Finally we used another aggregation to get the sum of counts for each source_address,destination_address pair.Alternatively (and optimally), this query could have been written as given below. The above was taken for sake of clarifying the usage.
label=Allow label=Connection destination_port<1024 | chart count() as CNT by source_address,destination_address
Fields available in join queriesThe result of join queries are again rows of fields=value pairs. The raw logs are not included. If you are joining two result sets s1 and s2 then all the fields that are part of the result set can be referenced appending with s1. or s2. as applicable.
For example
[source_address=*] as s1 join [device_ip=*] as s2 on s1.source_address=s2.device_ip
In this case, all the fields that are part of the result set source_address=* can be accessed as s1.field_name. For example if the result set have a field called destination_port you will be able to access that as s1.destination_port. Likewise, all the fields in the result set of the second can be accessed as s2.field_name. You can rename the fields and do further aggregations as necessary.
Fields available in stream queries
[5 label=User label=Login label=Fail having same target_user within 5 minutes]
In this case, only the log_ts and the target_user is available for further aggregations and analysis.
Fields available in alert results
An alert is fired when a set of logs matches some pre-specified condition. When an alert is fired, the following variables are exposed to the notification interface.
alert_name, description,risk_level,detection_timestamp,search_link,rows_count,rows.
The rows_count contains the count of the the events particiapting in firing the alert. The variable rows is the set of results of the search query firing the alert. For notification each item in the result set can be accessed by iterating on this list using jinja templating.
For example if the query is as below
device_name=some_device| chart count() as CNT by source_address
You can use the following jinja template to access the values in the returned list.
{% for row in rows %}
{{row.source_address}}:{{row.CNT}}
{% endfor %}
The fields available in the generated alert for stream queries are slightly different. For example take the below query.
[5 label=User label=Login label=Fail having same target_user within 5 minutes]The jinja templating can also be used to access the fields in the participating events. For details please refer
-
"AQL: graph 'mssp_db' not found (while parsing)" pops up while using director console UI
Issue and Observation
The message "AQL: graph 'mssp_db' not found (while parsing)" pops up while using the Director Console UI.
The error indicates that the synchronization between arango and zookeeper is in progress and sometimes due to stale entry of any fabric enabled logpoints, the sync can get halted.
Solution
Log files at /opt/commander/bigstore/var/log/directorconsole/ can provide useful information
Check if the fabric enabled Logpoint is present in zookeeper
ssh into fabric server
/opt/commander/installed/zookeeper/bin/zkCli.shaddauth digest zkacl:Welcome@123ls data/<POOL_IDENTIFIER>/addauth digest commander:<enter password> ls /license/<LP identifier>get /license/<LP identifier>delete any stale or duplicate logpoint identifiers if present withrmr /<node id>
Trigger data fetch fron arangodb GUI
ssh into Director API
Edit /etc/ssh/sshd_config to enable ssh local port forwarding ,
AllowTcpForwarding yes
ssh -L 8529:127.0.0.1:8529 support@<logpoint ip>
Open chrome/firefox browser and enter url http://127.0.0.1:8529
Login as root/changeitSelect: mssp_db

select TimeStamp collection from
Collection > TimeStamp/progress
Change the value to “in_progress” and save the changes
ssh into the Director Console machine and restart the dc-front and dc-back containers with commands below:-
docker stop dc-frontdocker stop dc-backdocker start dc-frontdocker start dc-back
-
Director Patch update fails due to missing containers
During the installation of the DC/API patch update the containers might not be in running state due to unknown reasons, you can check the status of containers by running the command below:
docker ps # output from DC v1.7.0Below is output of docker ps on DC v1.8.0
Observation
In an ideal state, all three containers -dc-front, dc-back,arangodb are in a running and in healthy state (in DC v 1.8.0 there are 4 containers where tomcat is added). However in some patch upgrade cases the containers may be missing.
Solution
To check if the container is present but not running:
docker ps -a
If the container is shown, start the container with the following command:
docker start <container ID>
Now, continue with:
installcom-patch /path/to/<patch file>
If the container is not present run the command below:
cd /opt/commander/installed/system/cmdr-admin/root-actions
docker-compose -p dc up -d
The above command uses docker-compose.yml file to bring the containers up.
-
How to move /boot from zfs on root to ext4 filesystem?
Sometimes the Logpoint (zfs on root) is not able to boot hence dropping to "grub rescue>" shell, if the system is not able to boot even after reinstalling grub, follow the below steps to boot from ext4 formatted partition which is better supported by grub2
Attach new virtual/physical disk or usb stick .eg /dev/sdx
Boot from Logpoint 6.3.0 ISO or later, get to the command line
Part 1-
# modprobe zfs# zpool import -a -N -R /mntMount the root pool into /mnt# zfs mount LP_Pool/ROOT/lp_rootmount -t proc /proc /mnt/procmount --rbind /dev /mnt/devmount --rbind /sys /mnt/syschroot /mnt /bin/bash --loginexport ZPOOL_VDEV_NAME_PATH=YESgrub-probe /# Part 2# Preparing ext4 boot disk sgdisk -p /dev/sdxsgdisk -n 1:2048:4095 -c 1:"BIOS Boot Partition" -t 1:ef02 /dev/sdx#below command will create new partition number "2" of size 3219MB sgdisk -n 2:4096:6291456 -c 2:"Linux /boot" -t 2:8300 /dev/sdxmkfs.ext4 /dev/sdx2 mv /boot /oldbootmkdir /boot
Now, mount the ext4 formatted usb disk to /boot
mount -t ext4 /dev/sdx2 /boot/rsync -aP /oldboot/* to /boot
get UUID of /dev/sdx2 and append to fstab as below:-
blkid | grep sdx2 # this will give uuid of sdx2
Edit /etc/fstab file:-
UUID=1b1d424c-9fd1-4fd2-aba7-80252f1a8d64 /boot ext4 defaults 0 2
grub-mkdevicemapgrub-install /dev/sdxupdate-grub2update-initramfs -u -k all
Exit from chroot
# zfs unmount -a# zfs set mountpoint=/ LP_Pool/ROOT/lp_root# reboot
In the bios settings make sure you select the disk just configured as a primary boot device
-
ZFS Tuning
Its recommended to maintain 20% free space on the zfs pool, storage usage of more than 80% will lead to poor IO performance and longer resilver times on raidz or mirrored pool if any disks is being replaced.
By default, ZIL or zfs intent log) lives on the same ZFS vdevs. Not only is the writes to the ZIL on rotating disks are slow but those writes and reads are competing with other disk activity this also means double writes on the same pool vdevs.
These double writes can be prevented by disabling sync on the pool, eg.
zfs set sync=disabled PoolName
this configuration poses the risk of loosing a few seconds of data if there is a sudden power loss on the server.
set xttr=sa
zfs set xattr=sa PoolName
The dedicated zil log device can improve write performance, to add a log device,
zpool add PoolName log /dev/disk/by-id/<id of ssd log disk>
Below values can be set to control the zfs arc memory (unit is bytes)
echo "9663676416" > /sys/module/zfs/parameters/zfs_arc_maxecho "1073741824" > /sys/module/zfs/parameters/zfs_arc_min
On slower storage servers the default dirty data value may be too high and can lead to kernel hung tasks timeouts. Usually on larger memory systems eg 100GB or more you can lower the dirty data value.
Default value of zfs_dirty_data_max : 10% of physical RAM, capped at zfs_dirty_data_max_max . The default value of zfs_dirty_data_max_max is 25% of physical RAM
To set 128MB as dirty data max value
echo "134217728" > /sys/module/zfs/parameters/zfs_dirty_data_max
Other tunables can be found here
User groups in Zendesk Community allow members to connect, share insights, ask questions, and collaborate within specific interest areas.