Welcome to Logpoint Community
Connect, share insights, ask questions, and discuss all things about Logpoint products with fellow users.
-
Introducing /logpoint Playbook Explorer
Hi All,
Have you ever found yourself asking the following questions while using /logpoint SOAR?
-
What do i need to do to run a specific playbook?
-
What playbooks can i run with my current set of integrations?
-
What integrations should I get to run a specific playbook?
In case the answer is yes, we have exciting news. We are pleased to announce the launch of /logpoint playbook explorer, a compact tool helping you to maximize the security value of your integrations and SOAR playbooks.
For your convenience, we have also created a short walk-through video attached below.
You can access /logpoint playbook explorer via the link below:
https://docs.logpoint.com/playbook-explorer
Should you have more questions, do not hesitate to reach out to us here or via customersuccess@logpoint.com
-
-
New in KB: Addressing delayed Logs and its uncertainty with /logpoint.
Hi All,
We are delighted to share our latest KB article addressing the difference between two fields, log_ts (event creation time) and col_ts (event ingestion time in log point) in logs and how they can alter the expected behavior of logpoint service. You can access the article via the below link:
-
New in KB: How to use NFS storage as backup directory?
Hi All,
We are excited to share a new knowledge base article guiding you through the steps on how to use NFS storage as backup directory. You can access through the following link. https://servicedesk.logpoint.com/hc/en-us/articles/5068106299805-How-to-use-NFS-storage-as-backup-directory-
-
Threat Intelligence - What are your experiences \ do you have recommendations ?
Hello,
just wanted to “pick the brains” of my fellow LP community member regarding TI. Is anyone here actively using the Threat Intelligence feature of the LogPoint and \ or has any recommendations and experiences on the matter. Personally i think it could be a very valuable part in a LogPoint environment to increase the detection capabilities, but have not be able to set it up in a way that would really beneficial.
This is mainly due to the fact that i haven’t been able to find a decent (free) TI feed, and to my mind, the value of TI stands and falls with the quality of the feed data.
Most of my customers have their firewalls, spam and web filter devices and mostly even their centralized AV solution sending their logs to LP. Setting up monitoring DNS request wouldn’t be a problem either. So i think we have enough visibility into the network traffic. Having a decent TI feed could allow us to compare these logs for known IoC (IP, hostnames, email addresses) and take a look at endpoints who have visited known malware URLs (spreading malware, being C2C server etc) or have received emails from known bad hosts in the past. You could then take a closer look at these endpoints if these could have been compromised.However, i have tried several freely available TI feeds, but none of them had the quality to be actually useful. Most had a lot of false positives as the feed are not updated regularly or have very outdated informationen. Additionally, these feeds also had a lot of false negatives (IP, URLs which were blocked by Google for days were not included yet). None of my customers has the manpower to sieve through hundreds of incidents a day just to find out the IoC is actually of a malware campaing from 2020.
How are your experiences with TI feeds, paid or unpaid ? I have to admit that, due to the rather poor experiences with free feeds, i did not look into any paid feeds (though i am trying to find the time to take Recorded Future for a test ride :-) i think they still have a demo offer)?
Does anyone of you have a recommendation for a feed ? Are paid feeds worth their money, and how much do they roughly cost ?
Regards
Andre
-
SOAR VirusTotal API integration
Hi, Is anyone using the VirusTotal integration into their SOAR?
I was all for getting it setup until I saw that you cannot use the free Public API in a commercial product.“The Public API must not be used in commercial products or services.” ( https://developers.virustotal.com/reference/public-vs-premium-api )
So, is anyone using the Premium API? and is it really $10,000 per year?
Or are you sticking to the public API and hoping to not get blacklisted?
Cheers
-
Emerging Threats: ChromeLoader
Our research team have been taking an in depth look at ChromeLoader. An innocent looking malvertiser that masquerades as a cracked game or a pirated movie sometimes placed on social media.
Read here ⇉ https://bit.ly/3N2vHEo and download the report here ⇉ https://bit.ly/3tRZZDc to ensure you’re taking the best steps to remain protected.
#SIEM #SIEMSOAR #Cyberthreats #CyberSecurity #Malware -
FortiMail Logs not Correctly Separated into Multiple Lines
We recently added a FortiMail appliance as a log source to one of our logpoints and now see an issue during collection and normalization.
It seems that FortiMail is sending the log messages without separating the single messages with a newline or NULL-termination or something else. Thus the syslog_collector is reading from the socket until the maximum buffer length is exceeded.
So we get a maximum length raw log message (10k characters, which then breaks in between a log message), which contains up to 30 or 40 single log messages, which are written one after the other. The normalizer then normalizes only the first message and discards the rest.
Here a shortened example of how this looks like:
550 <6>date=2022-06-20 time=07:24:11.992 device_id=[...]553 <6>date=2022-06-20 time=07:24:11.992 device_id=[...]479 <6>date=2022-06-20 time=07:24:11.992 device_id=[...]324 <6>date=2022-06-20 time=07:24:12.279 device_id=[...]Is there a way to resolve this issue?
-
Set logpoint as collector and SOAR
Hi ,
I have a question regarding configuration of Logpoint. Can we set logpoint as a collector andat the same time with enable the SOAR? Can we only use one server and set as one console for both?
-
Search Query Placeholder/Wildcard for Exact Amount of Characters?
Is there a way to replace a certain number of characters with a wildcard in a search query? The asterisk (*) is unfortunately too unspecific for my purposes.
In other query languages there is for example the "?" for a character, or in regex the ".{n}" quantifier, where "n" is the number of characters.
A typical application would be the detection of a base64 encoded single char variable assignment like this:
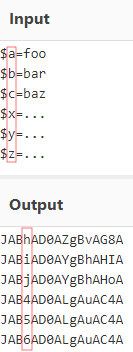
thus having a search query like this would be very helpful:
script_text=”*JAB?AD0A*” -
EventHubs: Azure AD Identity Protection Timestamp Format
We recently noticed that some Azure EventHubs Applications (e.g. the Azure AD Identity Protection -> https://docs.microsoft.com/en-us/azure/active-directory/identity-protection/overview-identity-protection ) are setting the "time" field not in the ISO 8601 Datetime format, but in the "general date long time" format (see https://docs.microsoft.com/en-us/dotnet/standard/base-types/standard-date-and-time-format-strings#GeneralDateLongTime ).
Thus the month and day field seem to be mixed up in these cases, and e.g. events that were actually collected on 6th of april (according to col_ts ) are sorted into the repos on 4th of june (because of the wrong log_ts ).
Also alert rules on these events are then triggering months later, when the accidentally wrongly sorted events slip into the current window of the search time range.The following screenshots shows how the timestamp format of the Azure AD Identity Protection differs from the usual ISO 8601 format.

Do you know if it is somehow possible to change this log timestamp format somewhere in the Azure AD settings?
Or has the compiled normalizer of the EventHub events to be adjusted?
-
How to configure Recorded Future application on Director
Hi,
I’m trying to configure Recorded Future application throug director on fabric enabled LogPoint. I was able to install application through Director on required host but I can’t configure.
On director Recorded Future is not visible under plugins nor as a sub-type of Threat intelligence plugin. On AiO SIEM on which plugin was installed I can see it under configuration but when I try to configure I’m getting error “Invalid action while Fabric Connect is enabled”.
Any ideas?
-
Microsoft Defender ATP v5.1.0 is now released
Dear all,
Microsoft Defender ATP v5.1.0 is now released and publicly available on the Help Centre via the link below:
https://servicedesk.logpoint.com/hc/en-us/articles/360007378817
-
Connecting FortiSIEM with LogPoint SOAR
Hi,
Can FortiSIEM from Fortinet product connecting to LogPoint SOAR?
IF yes, can share with me the step or the action needed.
-
Spring has finally sprung! But this #Bumblebee isn’t interested in pollination - This one’s a malicious downloader.
In the third instalment of our Emerging Threats series our researchers took a look at Bumblebee’s evolution and determined how you can best protect your organisation with in-depth analysis and response via #Logpoint
For the full article, click here: https://www.logpoint.com/en/blog/buzz-of-the-bumblebee-a-new-malicious-loader/
-
How can we get report or dashboard how many rules triggered overall in logpoint
How can we get report or dashboard how many rules triggered overall in logpoint
-
Layout Templates import
Hi folks, just a quick one.
I noticed on the Layout Templates section of the Reports tab that you can import a template. However, it doesn’t look like you can actually export a template. So, my question is - what kind of template do you import?
Is there a specific file format or report schema that needs to be used, or does that option just not do anything at the moment?
I did look on this page but there didn’t seem to be an explanation there either.
-
SSL certificates for Web Interface with 1x Root CA and 2x Intermediaries
Hi folks,
We’re hoping to add some SSL certificates to our LogPoint installation for the web interface, but just wanted to clarify some information. We currently have SSL certificates with a Root CA and 2 intermediaries - do these need to be combined into a fullchain certificate, or does each part need to be put somewhere else in the LogPoint installation?
I saw this post with a reply from Nils referencing the CSR, which is great, but we just want to make sure that we’re putting the certificates in the right place.
If the certificate files do need to go somewhere else, I’m assuming they can’t be uploaded via the web interface?
-
alert creation with ForeScout
Hello,I would like to create several use cases for the "ForeScout" security device.Do you have any ideas how I would like to set up alerts with ForeScout?
-
Backup best practices
Hello,
I’m designing my backup. So far in the documentation, I’ve read two options: application snapshot and application backup, both are writing to the local disk.
Let’s put aside the configuration backup as it’s less than 1 GB. The real challenge comes with backing up repos.
In an on-prem infrastructure, backups are stored in the backup infrastructure, with VTL and so on. There’s no way I can request to double the size of the repo disk just to store a consistent backup that I will have, then, to transfer to the backup infrastructure.
In a cloud infrastructure, the backup would go directly to the object storage such as S3 Glacier. Neither would we rent a disk space used only during backup, though it might be easier to do in a cloud environment.
In addition to the backup and snapshot methods from the documentation, I should add the option of disk snapshot, either from the guest OS or from the disk array (only for on-prem infrastructure). These would provide a stable file system onto which the backup software must run (as snapshots are not backups). There is also the option to snapshot the entire appliance from the hypervisor and hope for the best.
Now, let’s say I’ve got 30 TB of logs I need to backup, which accounts for about one year of logs.
When I look at the documentation options, I would have to schedule a daily backup with the last day of data (but it doesn’t seem dynamic in the options), which would copy the files under /opt/makalu/backup/repos I assume, and then use SFTP to fetch these and find a way to inject them in the backup software. That doesn’t seem convenient at all.
We need to add to the previous thoughts the restoration use cases:
- The deletion of repo data by fucking up the retention configuration (I think it’s not possible to delete a repo that contains data)
- A corruption of the filesystem or destruction of the appliance
In case 1, we’d need to restore only a repo. In case 2, we need to restore everything.
When I look at the filesystem under /opt/makalu/storage, it looks neatly organised by year, month and day folder, then we’ve got unix timestamp filenames with in .gz (which triggers another question about the use of ZFS compression if the files are gzipped anyway). So, for case 1, if I could restore the appropriate folders of lost past data, I should be good. For case 2, if I restore the entire filesystem, I should be as good as possible. Maybe the filesystem won’t have the last commit on disk, but it shouldn’t be corrupted.
So, why is there all this backup thing in place that duplicates data locally for log repos? What am I missing that could just prevent good restoration if I backup the filesystem (that the hypervisor backup software should be able to quiesce externally and backup)?
Would the following be consistent?
- Run the configuration backup with LP job (because it looks like there’s a database and so on)
- Get the hypervisor to tell the guest OS to quiesce the filesystem, then snapshot the disks
- Backup the disks with whatever differential backup the backup software can do
Of course, it’s unlikely sysadmins will want to backup the 30 TB logs every day, because I predict the deduplication on an encrypted filesystem won’t be good (ha, I didn’t say but for regulation compliance the repos are encrypted by ZFS). Still, it could be a valid scenario.
How do customers backup large volume of logs?
-
BoxAudit_v5.1.1 application release
We have released the BoxAudit_v5.1.1 application publicly in the Help Centre.
To find out more, you can find the application package here: https://servicedesk.logpoint.com/hc/en-us/articles/360002071597 and the documentation here: https://docs.logpoint.com/docs/boxaudit/en/latest/
-
SpringShell - Research conducted on the emerging SpringShell family of vulnerabilities
Read latest blogpost where LogPoint provides an overview of the research conducted on the emerging SpringShell family of vulnerabilities – A Remote Code Execution(RCE) based exploit found in the popular JAVA framework, Spring. The blog post is accompanied by a Logpoint Emerging Threats Protection report, covering detection methods, investigation playbooks, and recommended responses and best practices.
Enjoy
https://www.logpoint.com/en/blog/springshell-not-spring4shell-a-blooming-hype/
/ Brian
-
Deep Dive Session on Scaling and Sizing 26th April 2022
In this post you will find the materials from todays session on Scaling and Sizing of Logpoint.
Attached you will find the slides used in the presentation today and below you will find the relevant links:
- Sizing helper download page: https://servicedesk.logpoint.com/hc/en-us/articles/360010077997-LogPoint-Sizing-Helper
- Rules of thumb: https://servicedesk.logpoint.com/hc/en-us/articles/360007454618-LogPoint-Sizing-Criteria-Rules-of-Thumb-2020-
- EPS estimate calculator: https://siemsizingcalculator.logpoint.com/
- SOAR sizing guidelines: https://docs.logpoint.com/docs/getting-started-with-soar/en/latest/
The system overview mentioned can be found in your logpoint environment under Settings System System Monitor. Besides that, you can use the following queries to get an overview of the system resource usage searching in the _logpoint repository:
- Disk : logpoint_name=* device_ip="127.0.0.1" label="harddisk" mount_point="/opt/makalu/storage" | timechart max(use) by logpoint_name, mount_point every 1 hour
- CPU : logpoint_name=* device_ip="127.0.0.1" label="CPU"| timechart avg(use) by logpoint_name every 10 minute
- Physical Memory : logpoint_name=* device_ip="127.0.0.1" label="memory physical"| timechart avg(use) by logpoint_name every 10 minute
- Virtual Memory: logpoint_name=* device_ip="127.0.0.1" label="memory virtual"| timechart avg(use) by logpoint_name every 30 minute
- Started reports : "source_name"="/opt/immune/var/log/report/report.log" | process regex(".*status\=\s*(?P<status>.*?)\;",msg) | search status=Started | chart count(status) as Startede_Rapporter
- Failed reports : "source_name"="/opt/immune/var/log/report/report.log" | process regex(".*status\=\s*(?P<status>.*?)\;",msg) | process regex(".*msg\=\s*(?P<message>.*)",msg) | search status=Failed* | chart count(status) as Fejlede_Rapporter
Kind regards
Logpoint Training Team
-
Ideas: How to automatically (unit) test alert rules?
We use a large and growing number of self-developed alert rules for our customers, which we manage and develop further in an internal git repository via gitlab. For quality assurance in the continuous integration process, we still need a way to test the alert rules automatically.
The idea is to check whether each alert rule triggers on the necessary events and behaves as expected in borderline cases. Very similar to unit testing in software development, just for alert rules instead of source code.
Our idea so far is as follows:
- Connect an up-to-date LogPoint as a virtual machine as a QA system to our Director environment
- Create a snapshot of the "freshly installed" state
- Restore the snapshot via script from the gitlab CI pipeline
- Use the Director API to add a repo, routing policy, normalizer policy, processing policy for the different log types
- Use the Director API to add a device and syslog collector with the corresponding processing policy for each log type
- Use the Director API with our deployment script to deploy all alert rules
- For each alert rule, there is then a formal test specification that uses another script to send predefined log events with current timestamps to the logpoint system and check them against the expected triggering behavior of the enabled alert rules in the specification
- The CI pipeline status is set to "passed" or "failed" accordingly
Are there any ready-made approaches here, or recommendations on how to implement the above?
-
Top 5 SOAR Use Cases
Analysts are constantly swamped with alerts, and to deal with this, they have to rely on repetitive manual tasks. This is like putting water on an oil fire, making the situation much worse and more time-consuming.
SOCs need a solution that enables them to manage and prioritize their workflow efficiently by giving them the ability to collect security threat data and alerts from multiple sources. This is where Logpoint steps in.
Previously we identified top use cases for SIEM . This time here are five common SOAR use cases that every organization should implement to reduce alert fatigue, overload and subsequently increase productivity in your SOC team.
01 Automated alert triage and enrichment
02 Endpoint malware mitigation
03 Automated Phishing Investigation and Response
04 Automated Threat Intelligence management
05 Ransomware mitigation01 Automated alert triage and enrichment
Logpoint SOAR automates alert triage and enriches the alerts with additional information from multiple sources enabling analysts to focus on incidents requiring human intervention.
Usually, SOCs must deal with security alerts by manually reviewing and investigating all security alerts that lack additional context. That is a challenging and costly circumstance.
Logpoint SOAR integrates with many solutions, such as HR or travel systems. This functionality allows additional information to accompany the alert, which means the threat(s) are dealt with swiftly.
02 Endpoint malware mitigation
Endpoints are increasingly targeted by malware attacks, with smartphones and laptops being the most vulnerable targets. The occurrences are increasing due to the move to remote working and endpoints operating outside of the organizational network.
These circumstances generate false positives or low severity cases, and addressing these manually results in long response times, thus increasing risk.
Within seconds Logpoint SOAR can orchestrate and automate actions to investigate and respond to the high volume of alerts and determine the severity and respond accordingly, ensuring that the security team prioritizes the most critical malware attacks, drastically minimizing risk.
03 Automated Phishing Investigation and Response
Phishing attacks are not going anywhere soon, and in fact, they are on the rise. Did you know that 36% of data breaches involve phishing attacks?
Manually investigating a phishing alert can take hours or even days for the analysts and require multiple security tools.
Logpoint SOAR accelerates the phishing investigation and response time from hours to minutes with out-of-the-box and automated playbooks, which severely reduce time wastage and, in contrast, aid efficiency and productivity within SOC teams.
04 Automated Threat Intelligence management
Logpoint SOAR automatically collects and centralizes threat data from various threat intelligence sources, ensuring analysts can leverage the most current threat intelligence data and can use it to discover malicious indicators or to understand how different alerts are connected.
This enables faster response times to real threats and drastically minimizes risk.
Logpoint SOAR’s threat intelligence capabilities include the centralized collection of TI, a lower risk rating on a TI feed based on actual false positives found, and fusion and deduplication of TI feeds.
05 Ransomware mitigation
A considerable percentage of organizations were victimized by ransomware last year, and the attacks are on the rise, with variants constantly evolving.
Manual responses to these attacks are challenging as the techniques used are becoming more advanced, and more companies are willing to pay for their data to be recovered. Therefore, rather than constantly improving existing endpoint protection platforms, companies should use a solution that can successfully detect and respond to the attacks.
Here time is a critical factor. Logpoint SOAR acts quickly and automatically based on the classification of the alerts mapped to the MITRE ATT&CK framework. Detection, classification, investigation, and response are tied together, further expediting the incident investigation process.
For more in-depth information on these use cases check our SOAR brochure or ask for a demo via customersuccess@logpoint.com
-
New in KB: How to locate internal logs in LogPoint?
LogPoint stores its internal logs in the /opt/immune/var/log/ directory. Here is the description of the most useful log types inside that directory.
-
Service logs
/opt/immune/var/log/service/<service_name>/current
This holds the internal service logs for each of the service of LogPoint. The current is the file in which logs are currently being written. The log files are regularly rolled over and are kept in the same directory as current .
-
Benchmarker Logs
/opt/immune/var/log/benchmarker/<service_name>.log
This contains the benchmarker data for various services. Not all services are benchmarked but important services like norm_front, normalizers, storehandlers, indexsearchers, premerger, various collector & fetchers have benchmarker data in this location.
-
System Metrics Logs
/opt/immune/var/log/system_metrics/system_metrics.log
This contains the operating system metrics that is regularly benchmarked in the system. It contains the information of CPU Usage, Memory Usage, Network Usage, Hard Disk Usage kept every 1 minute.
-
Audit Logs
/opt/immune/var/log/audit/<service_name>.log
This contains the audit logs of various services in LogPoint. For example, one of the useful is that of webserver, which contains information of which user made what changes at what time from the UI.
These information can also be obtained from LogPoint's Search as these logs are collected using the file system collector into the _logpoint repo. These are normalized as well, so with appropriate queries we can even construct dashboard widgets and alert rules based on the data from these internal log files.
Some useful queries:| chart count() by source_name
label = Benchmarker
"source_name"="/opt/immune/var/log/benchmarker/norm_front.log"| timechart avg(actual_mps)
"source_name"="/opt/immune/var/log/benchmarker/store_handler.log"| timechart avg(actual_mps)
-
Service logs
-
New in KB: How to handle a repo failed issue
We occasionally encounter cases where we cannot perform search because a particular repo has failed. In that situation, the search UI does not allow to make any searches if that repo is selected.
What does "repo failed" mean?
The "readiness" status of service responsible for searching in a particular repo (indexsearcher) is kept by central searching service (merger) in "alive" field for each repo. If the "alive" status of a repo is false in the config file of merger service, failed repo issue is seen when making search in that repo. This could happen if index searcher service for that repo is not running as expected or if the config file of the merger service is not updated according to the status of indexsearcher service.
Mitigation:
Whenever we get repo failed for a particular repo then it is always wise to check the logs for the indexsearcher service of that repo.
tail -f -n 50 /opt/immune/var/log/service/indexsearcher_<repo_name>/current#replace <repo_name> with actual repo name. for e.g. for repo with name "Windows",the command will betail -f -n 50 /opt/immune/var/log/service/indexsearcher_Windows/current
The above command will output the last 50 logs for the indexsearcher service of the particular repo.
You can also check if indexsearcher is replying back to alive probe with tcpdump on query.source.socket.
grep "query.source.socket" /opt/immune/etc/config/indexsearcher_<repo_name>/config.jsontcpdump -i any port <query.source.socket port> -Aq
If indexsearcher is alive, you should see
{"isalive":true}and{"alive":true}messages
If there are no errors in the
tailcommand and"alive":truemessages are being seen in tcpdump commands but the failed repo error is still being seen with search, try checking alive status in merger config.grep -B1 alive /opt/immune/etc/config/merger/config.json
Potential Scenarios
-
Indexsearcher service is recently restarted
If an indexsearcher service for a repo is just restarted then for large repos it takes few minutes to scan metadata for stored indexes, before searches can be served. During that period, the repo failed error is observed. -
LogPoint machine is recently rebooted
If a LogPoint machine is recently rebooted then the indexsearcher services take time to initialize services. During those few minutes, repo failed error can be seen for some repos.
-
Issue in the indexsearcher service
If there is some error in the indexsearcher service, then repo failed issue does not resolve on its own.
In such scenarios, please review the logs of the indexsearcher service as mentioned above. It is recommended to create a support ticket in such scenarios for further investigation and resolution of the problem. It will be helpful to include the service log of indexsearcher service of that repo in the ticket. The log file is located at/opt/immune/var/log/service/indexsearcher_<repo_name>/current
-
Indexsearcher service is recently restarted
-
New in KB: How to handle report generation failed ?
When we encounter cases when report fails to generate, There might be several reasons why this happened. Here are the list of things that can be attempted to handle report generation issues:
-
Try running the report again
Sometimes, report might fail when there is high load in the system. And just trying to run the report again after sometime might result successful generation of report.
-
Try increasing the heap_size of the report
There is an option in the report template (in the right side) to increase the heap_size of the report job. Large reports (reports with more number of queries and large time ranges) require larger memory.
So, increasing the heap_size incrementally from 512 MB to few GBs (up to 4GB) can be helpful.
-
Try searching for each of the query in the report in search, if they are working fine or not
This is kind of a brute force way to figure out the problematic query or query which might be causing the report failure.
If any of the repo is down or if any of the query has issues, then report might fail. So, even though this step might take some time, this can be really helpful.
-
Try splitting the report if there are too many queries
Sometimes, due to large size of the report (both in number of queries as well as in terms of timerange), the amount of data to be handled can be rocket high, hundreds of millions of events.
Splitting the report both in terms of queries as well as splitting the timerange of the report can also be helpful.
-
For Scheduled Reports
If the report is scheduled, it is wise to see if there are any other reports scheduled at the same time or not. If that is the case then, trying to schedule less reports simultaneously can help. This will reduce the load in the system.
-
Contact to support
Even after trying above steps, if the report is still failing then it's time for some expert eyes. Please contact the support in that scenario. But try to attach the following information in the beginning itself so that support staff can act quickly in the issue.- Attach the screenshot of the error message as seen in the report jobs status.
-
Also, attach the following file from the backend:
/opt/immune/var/log/report/report.log
This file contains more details about the failed report.
Some Potential Scenarios
1. Report Gets Timed Out
Sometimes large reports might take more time to complete than the default time out period for the reports (30 minutes). If the report times out, the timeout period needs to be increased to accommodate for large reports. This can be done by support staff.2. Report stays at running state and neither completes nor fails
If the indexsearcher service is restarted midway when a report is generating, then the report can stay in running state. In that case, we need to check if any related repo's indexsearcher service has restarted when report was running.
And if that is true, cancel the report job and start generating report again. -
Try running the report again
-
New in KB: How to handle diskfull issues
Occasionally, we encounter issues where one of the mount point in LogPoint is full. The disk full conditions can be because of various reasons and it is of utmost importance to immediately free some disk so that LogPoint can function normally.
Under disk full situations for /opt and primary repo path /opt/immune/storage locations, the log collection of LogPoint will be affected.
Detection
To detect the disk full situations, we can use the df command.
df -h
In the output of this command, we can either look for the percent usage of each mount point or the available storage space. These indicators will help us detect disk full scenarios.
Mitigation
Now, once we find out the problem in LogPoint is because of lack of storage space, we can dive deeper.
/opt path has 100% storage used
The /opt mount point generally stores the necessary config files, service log files, mongoDB data and executables of LogPoint. For normal functioning of LogPoint it is critical to have some storage space available.
Since in normal scenario, this mount point does not actively store much data, it is unlikely to have storage space 100% used. But when it encounters such cases, we have to investigate using du command and find out which directory or file is the cause of disk getting full. The command that helps out is as follows:du -sch <file_1> <file_2> <directory_1> <directory_2>#To check all files and folder in current working directorydu -sch *
It is important to try this command manually across the directories inside /opt to detect the culprit. Note: /opt/immune/storage is usually mounted to a different pool or lvm.
Frequently encountered cases
-
Storage occupied by old upgrade patch files.
The old upgrade patch files are stored in /opt/immune/var/patches/installed/ directory. These patch files range from few MBs to hundreds of MBs and they can be reason for /opt being full. These older patch files can be deleted, if we are sure that these old upgrades are successfully installed in LogPoint.
-
Storage occupied by mongoDB data directory
The mongodb's data directory is /opt/immune/db/ . Sometimes the size of the db can be huge when the LogPoint has too many configurations data.
In that case, please contact LogPoint support.
-
Storage occupied by service log files
The service log files are stored in /opt/immune/var/log/ directory. In some cases when some service is in debug mode or due to some errors some log files can swell to unexpected size. In that cases, we have no option but to delete such files. We have to locate such anomalous files and delete them. This can be done by the same du command to check file size.
Since the content of those files are already indexed into LogPoint's log ingestion pipeline it is fine to delete the service logs. But only do so, if you are sure, else contact LogPoint support to do so.
-
Storage occupied by nxlog dump files
We have observed this issue in few customers when nxlog dumps some files in the directory
/opt/nxlog/var/spool/nxlog/ .
These files might can cause storage full in /opt mount point. So, cleaning the dump files or just moving them to other larger mounts should help. This issue has been addressed by recent version of LPAgent so, please update it to latest one to avoid having this issue.
/opt/immune/storage has 100% storage used
Usually /opt/immune/storage mount point has larger storage space compared to /opt because it has to store the logs and indices files as primary retention path.
If this mount point gets 100% used, then log collection gets halted and related services will stop to function. It is important to fix such issues. To drill down which directory might be using a lot of space, same old du command does the trick.
The probable cases when /opt/immune/storage is full can be as follows:
-
Storage occupied by logs and indices
In most of the cases, when /opt/immune/storage is full, this is because of the logs and indices. The logs and indices directory grow in size because of the data stored by LogPoint.
In normal scenario we would expect disk size to be estimated properly so that, the logs stored will not exceed the provisioned space. Sometimes for some repos however there might be abrupt increase in event rate. In such scenarios we can either decrease the retention for the repos with most amount of data. Otherwise, we need to allocate more disk to accommodate increased log volume. -
Storage occupied by buffer directories
There are some buffer directories which sometime can fill up, due to issues in the LogPoint and that can cause storage full scenarios. These buffer directories can be as follows:- /opt/immune/storage/highavailability/ - Issue in the highavailability (HA) functionality.
- /opt/immune/storage/OldLogsKeeper/ - There are too much old logs coming in to the LogPoint machine.
-
/opt/immune/storage/FileKeepeer
- If there is an issue in the indexsearcher service then logs are buffered in this directory.
If any of the above directory are occupying too large space, then please call support for assistance.
In any of the above situations if you are not sure, it is important to call support for help. The paths mentioned here are for default installations. For some custom changes in the data mount point and so on, the paths might differ.
Note : The paths /opt/makalu and /opt/immune paths are actually same because in Logpoint /opt/immune is a soft symlink to /opt/makalu .
-
Storage occupied by old upgrade patch files.
-
New in KB: Troubleshooting LPAgent issues
Please follow the documentation for LPAgent at https://docs.logpoint.com/docs/logpoint-agent/en/latest/index.html carefully. Sometimes simple steps like processing policy or even the collector/fetcher are missed while configuring devices.
Important Considerations for LPAgent:
https://docs.logpoint.com/docs/logpoint-agent/en/latest/Important%20Considerations.html
Logs should be coming into the system in few minutes once the setup is done, but sometimes we don't see any logs in the search. Below we have described few common issues faced on customer environment and their debugging procedures.
Service Status:
Check if
lpagentprocess is running on windows side &lpa_managerandlpanx_collectorservices are running on LogPoint.> netstat -nap | egrep ':7998|:7999'____________________________________________________________tcp 0 0 0.0.0.0:7999 0.0.0.0:* LISTEN 30445/lpanx_collecttcp 0 0 10.10.1.74:7999 10.10.1.67:50459 ESTABLISHED 30445/lpanx_collect tcp 0 0 10.10.1.74:7998 10.10.1.6:64664 ESTABLISHED 30445/lpanx_collect tcp 0 0 10.10.1.74:7999 10.10.1.65:49956 ESTABLISHED 30445/lpanx_collect# 7998 or 7999 should be on listening state and # various established session should be seen with windows ip
LPAgent Issue:
-
There is a bug on lpagent installation for 6.11.x+ LP where necessary dependencies aren't installed properly. We can verify it by running below mentioned cmd. The fix should be released on future version but current workaround is to reinstall the plugin, make sure normalization packages and lpagent collector are removed from devices before deleting the application.
> tail -f /opt/immune/var/log/service/lpanx_collector/current____________________________________________________________FileNotFoundError: [Errno 2] No such file or directory: '/opt/nxlog/bin/lpanx_collector'
-
Nxlog has deprecated batching, so if you have enabled batching mode, please disable it and restart the
lpa_managerandlpanx_collectorservice. -
Orphan or duplicate process of
lpanx_collectorrunning, only one instance should be running on the server> ps -ef | grep /opt/nxlog/etc/lpanx_collector.conf | grep -v grep____________________________________________________________loginsp+ 30445 30404 0 2021 ? 04:22:00 /opt/nxlog/bin/lpanx_collector -f -c /opt/nxlog/etc/lpanx_collector.conf
Config & Cert Discrepancy:
If the windows side has only encrypted port allowed and logpoint agent is re-installed or cert is regenerated, windows won't accept connection with new certs. In such cases we can manually copy the conf and certs to the windows side.
Doing manual changes on large number of servers can be hassle. Therefore for syncing all the severs automatically following steps are recommended:
- Remove logpoint agent and associated device from configuration
- Re-install lpagent application on logpoint and allow 7994 port in windows side
- Add a new device and set the connection on TCP mode
- Once the connection is done, change the mode to TLS and push the config
File Permissions and Types:
Sometimes event logs are received but file collection module isn’t receiving any logs, either the file path wasn’t set correctly or the lpagent didn’t had enough permissions to read those files on the system.
Evtx files can't be fetched using file collection module.
Queue in Normalization:
Windows logs can cause queue in normalization layer if the normalization packages are in wrong sequence. For example; always make sure windows normalization policy has
LPA_WindowsaboveDNSCompiledNormalizer(has some regex checks which takes longer time). After that restart the normalizer service and queue should be decreased, 2nd and 3rd column would have persistent large values if queue is present in below output.netstat -nap | grep :5505____________________________________________________________tcp 0 0 127.0.0.1:5505 0.0.0.0:* LISTEN - tcp 0 0 127.0.0.1:58306 127.0.0.1:5505 ESTABLISHED - tcp 0 0 127.0.0.1:58092 127.0.0.1:5505 ESTABLISHED - tcp 0 0 127.0.0.1:5505 127.0.0.1:58292 ESTABLISHED - tcp 0 0 127.0.0.1:5505 127.0.0.1:58284 ESTABLISHED - tcp 0 0 127.0.0.1:58284 127.0.0.1:5505 ESTABLISHED –
Connection Issue:
Firewall Rules:
Port 7994-5 is used by LP to share conf and certs with windows. Inbound firewall for 7994 and 7995 needs to be open at windows.
[7994] – Unencrypted Communication Channel[7995] – Encrypted Communication Channel
Port 7998-9 is used to collect logs from windows by a service called lpanx_collector, outbound firewall is needed for 7998-7999 from windows to LP
[7998] – lpanx_collector [Unencrypted data channel][7999] – lpanx_collector [Encrypted data channel]
Note: This rules applies to the Collector LP Machine not Backend, if backend and collector LP are different. Please make sure the firewall or switch between logpoint and windows also have necessary rules and routes setup.
How to test if the endpoints are reachable and connected from Logpoint:
For unencrypted connection:
> telnet <windows_ip> 7994____________________________________________________________Trying windows_ip ...Connected to windows_ip# the windows is reachable from logpoint side> telnet <windows_ip> 7994____________________________________________________________Trying windows_ip ...telnet: Unable to connect to remote host: Connection refused# the windows is not reachable from logpoint side
For encrypted connection:
> openssl s_client -connect <windows_ip>:7995____________________________________________________________CONNECTED(0000003) # if reachable and certs are correct____________________________________________________________connect: Connection refusedconnect:errno=111 # if unreachable or certs are invalid
Current status:
> netstat -nap | egrep ":7999|:7998" | grep ESTABLISHED# Output contains all the established connections > netstat -nap | egrep ":7999|:7998" | grep -v ESTABLISHED# Output contains all the connections that logpoint is trying to make but fails# 5th column is the windows ip
On windows side you can just check the logs files to see if the connection is being broken or refused at C:/Program Files/lpagent/data/lpagent.log
CPU/Memory Spike:
- Unsupported file formats can cause overhead on nxlog processor.
- Selecting mem buffer instead of disk buffer can also cause memory spike if the connection isn't stable.
- Older LPAgent version had a memory leak, so please upgrade the plugin to latest version.
Note: LogPoint Agent is powered by NxLog and is just a user friendly way of sending logs via windows. If you are comfortable with nxlog, it can directly send logs to syslog port of LP which would eradicate some of the issue with LPAgent. For example: collection of custom evtx files.
Some of the commands might require root access, please consult support if above mentioned steps are confusing or didn't help you figure out the cause for the issue.
-
There is a bug on lpagent installation for 6.11.x+ LP where necessary dependencies aren't installed properly. We can verify it by running below mentioned cmd. The fix should be released on future version but current workaround is to reinstall the plugin, make sure normalization packages and lpagent collector are removed from devices before deleting the application.
-
Logpoint's status on CVE-2022-22965
CVE Summary : A Spring MVC or Spring WebFlux application running on JDK 9+ may be vulnerable to remote code execution (RCE) via data binding.
CVE Reference : https://nvd.nist.gov/vuln/detail/CVE-2022-22965
Logpoint Summary :
LogPoint uses spring framework in report engine, to connect with MongoDB using Spring-Mongo api. So, as transitive dependencies, spring-beans-3.1.2.RELEASE.jar is used. LogPoint does not have external exposure with this spring library as we are not using controller and accepting web requests via spring framework. Thus, we are not directly impacted by this vulnerability. We are also safe because of the following:
- We are not using any spring web framework.
- We are using Java 8 not Java 9 and beyond.
- We are not packaging in WAR and not using any servlet containers.
Director
- For LPSM, the impact is the same as for LogPoint.
- For other components in Director, we are not using spring libraries.
- We are still using Java 8 all across the product line.
Soar
- Currently any SOAR container running Java are running on OpenJDK 8 Alpine base containers.
User groups in Zendesk Community allow members to connect, share insights, ask questions, and collaborate within specific interest areas.